
Figure 3.
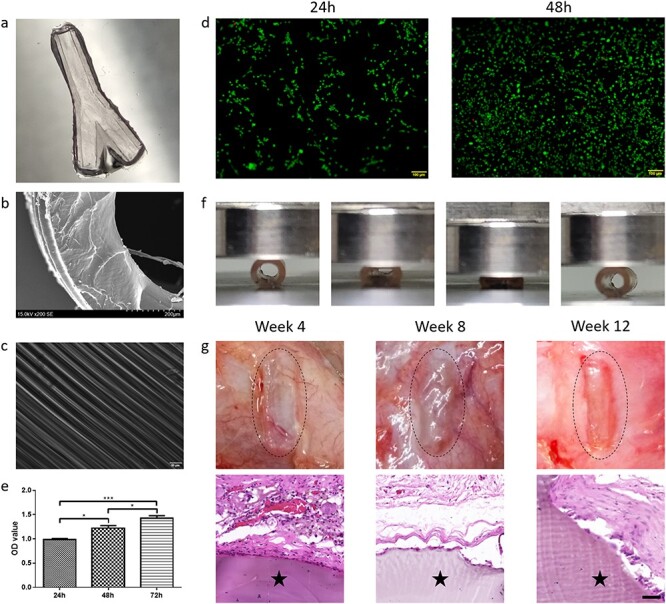
Preparation and characterization of the 3D-printed two-branch nerve conduit. (a) Photograph of the 3D-printed two-branch nerve conduit. (b) Scanning electron microscopy image of the nerve conduit (scale bar = 100 μm). (c) Surface microstructure of the nerve conduit. (d) The live/dead cell imaging kit detects the survival and proliferation of the PC12 cells on GelMA hydrogel at 24 and 48 h. (e) Quantitative proliferation analysis of PC12 cells by CCK-8 assay. Data are presented as the mean ± standard deviation, *p < 0.05, ***p < 0.001. (f) Compression mechanical properties of the nerve conduit. (g) Representative images of observation (upper) and hematoxylin and eosin staining (lower) of the conduits at 4, 8 and 12 weeks following subcutaneous implantation in rats (star: conduit; scale bar = 50 μm)