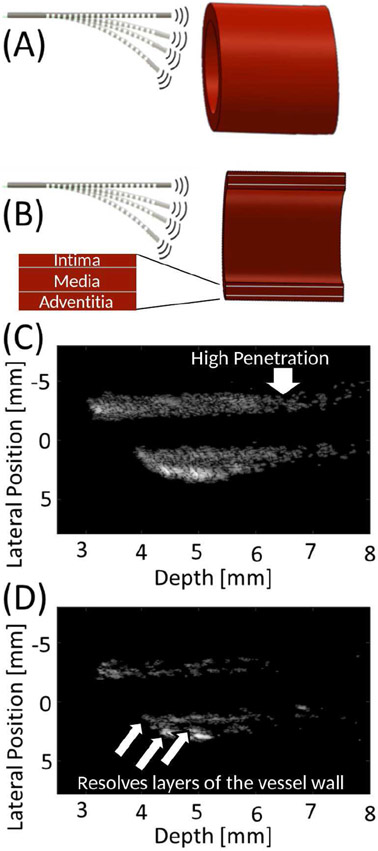
Fig. 10.
(A) Illustration of vessel orientation relative to the guidewire-based imaging system during acquisition of ex vivo porcine artery data, including (B) cross sectional view seen during imaging. B-mode image of vessel cross section acquired using (C) low and (D) high-frequency band of the dual-frequency transducer. Images in (C) and (D) are displayed with 40 and 30 dB dynamic range, respectively.

