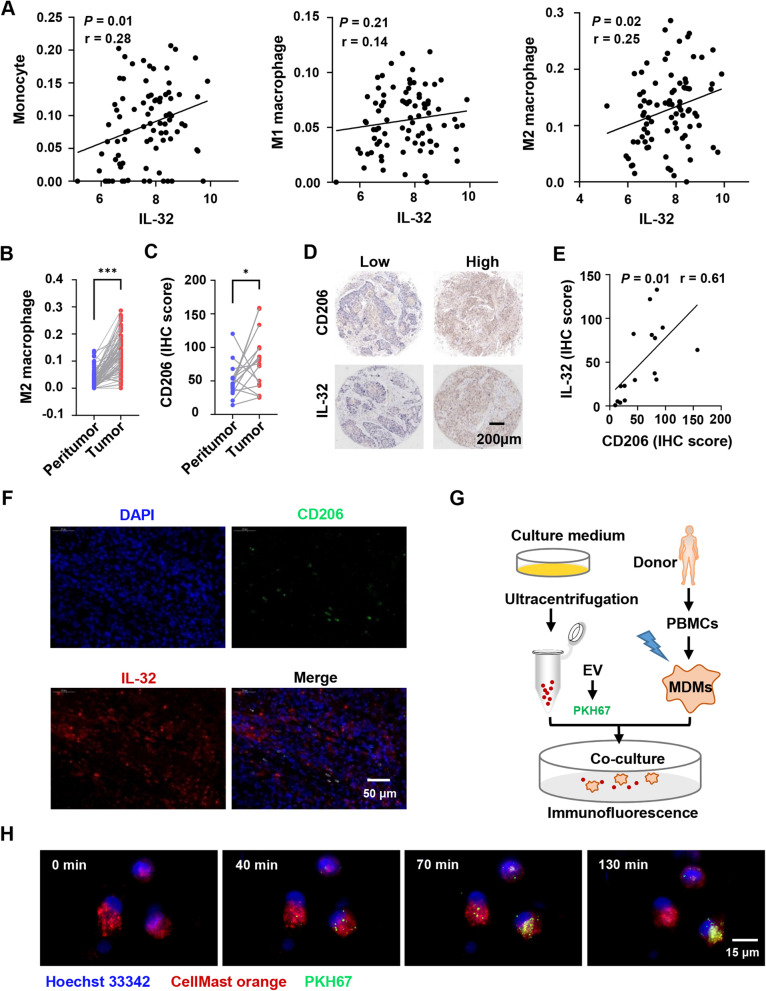
Fig. 4.
IL-32 expression positively correlates with the infiltration of M2 macrophage in ESCC. A Correlation coefficient between IL-32 and infiltrative monocytes, M1 and M2 macrophages in ESCC tumor tissues, and the subsets of infiltrative cells were performed by the bioinformatic tool xCELL. Each symbol represents an individual patient (n = 84). Pearson’s rank correlation test, *P < 0.05. B Infiltrative M2 macrophages in ESCC tumor and paired peritumor tissues were analyzed based on RNA microarray (n = 84). Paired one-tailed Student’s t-test, ***P < 0.001. C IHC tissue microarray was used to analyze CD206 expression in ESCC tumor and paired peritumor tissues (n = 16). Paired one-tailed Student’s t-test, *P < 0.05. D Representative IHC images of IL-32 and CD206 in the paired ESCC tumor tissues. Scale bar, 200 μm. E Correlation coefficient between IL-32 and CD206 according to IHC scores in ESCC (n = 16), Pearson’s rank correlation test, *P < 0.05. F Immunofluorescence images of the indicated markers (CD206 and IL-32) in ESCC tumor tissue. Scale bar, 50 μm. G Schematic diagram of the EV cocultured with induced MDMs. H Confocal fluorescence microscopy was used to detect the process that MDMs (Red) internalized EV (Green) derived from EC109. Scale bar, 15 μm. The data are representative of at least three independent experiments

