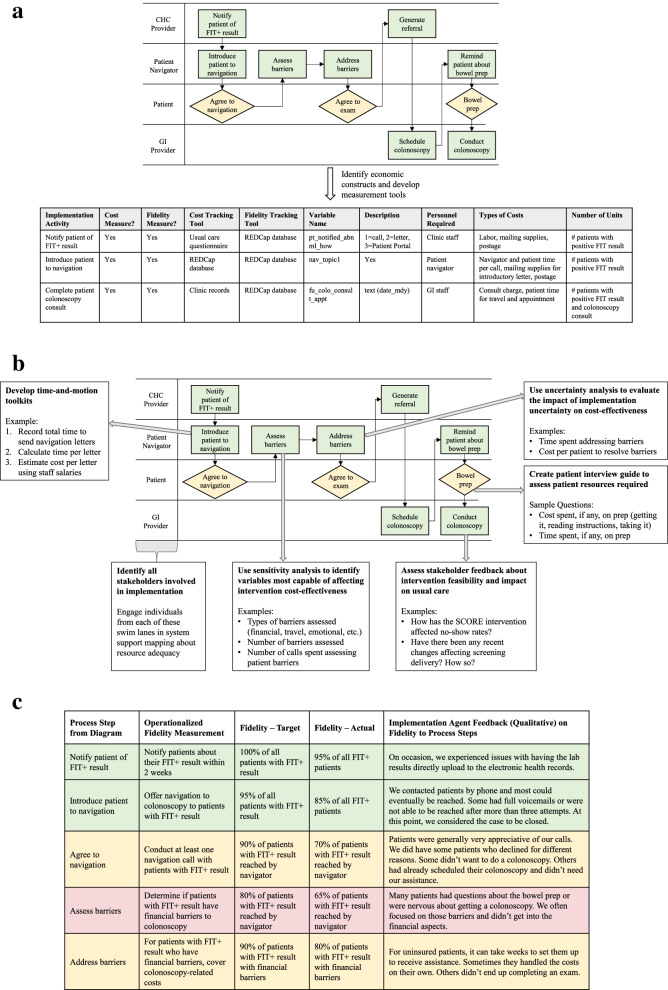
Fig. 1.
a Use of swimlane diagrams to identify economic and fidelity measures for the SCORE intervention during the Preparation phase. This is a simplified version of a process flow diagram for patient navigation to follow-up colonoscopy provided as part of the SCORE intervention. Examples are provided of how specific process steps are used to develop cost and fidelity measures and appropriate tools for measuring these constructs. CHC community health center, FIT fecal immunochemical test, GI gastrointestinal, SCORE Scaling Colorectal Cancer Screening Through Outreach, Referral, and Engagement. b Use of swimlane diagrams to inform mixed methods approach to estimating costs of implementing the SCORE intervention. This is a simplified version of a process flow diagram for patient navigation to follow-up colonoscopy provided as part of the SCORE intervention. For individual steps involved in implementing the patient navigation intervention, examples are provided for how diverse types of methods can be used to collect and estimate the required resources to implement that step. CHC community health center, FIT fecal immunochemical test, GI gastrointestinal, SCORE Scaling Colorectal Cancer Screening Through Outreach, Referral, and Engagement. c Example integration and presentation of mixed methods results. This is an example using hypothetical data of how we might integrate the quantitative results of our analysis (in this case, the proportion of patients who received each process step) with qualitative data from implementation agents. The color-coding is used to identify process steps from the process flow diagram included in (a and b) with low (< 70% of patients), moderate (between 70 and 84% of patients), and high (85% of patients or higher) fidelity. This structure can also be used to integrate cost estimates per step with qualitative findings

