Fig. 4.
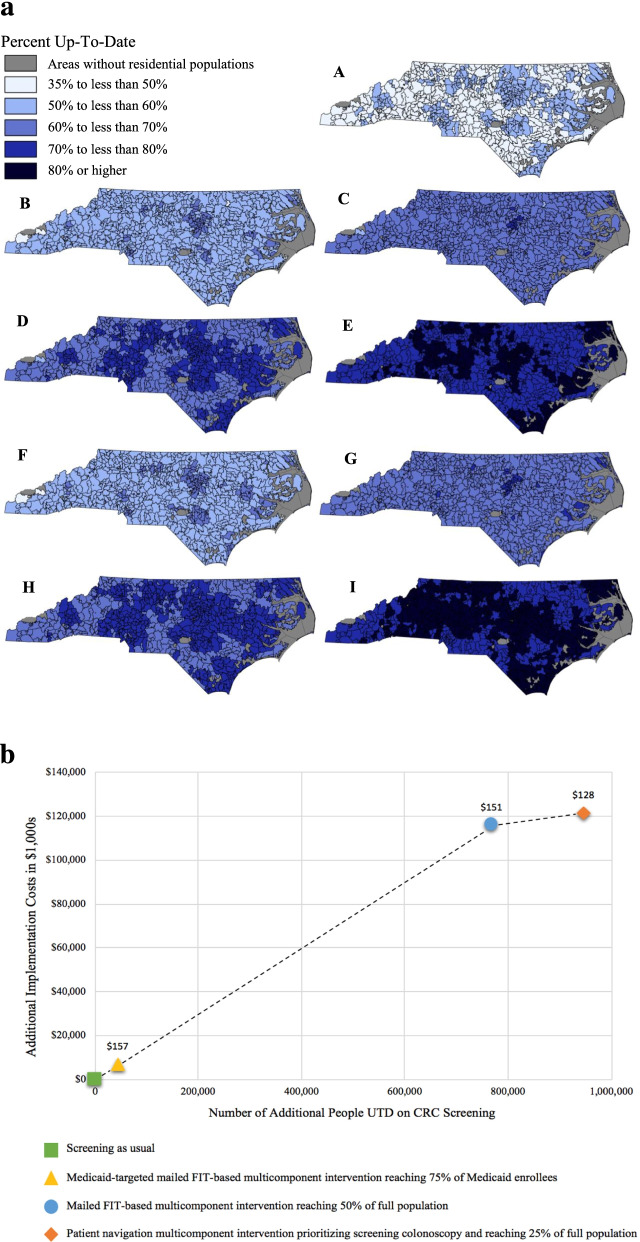
a Percent of eligible North Carolina residents up-to-date on CRC screening by zip code assuming different types of interventions, levels of intervention reach, and health insurance policy after 5 years of intervention. A: Status quo scenario (i.e., absence of intervention or health policy change). B: Implementation of mailed FIT-based multicomponent interventions, assuming 25% reach of eligible population and no Medicaid expansion. C: Implementation of multicomponent interventions prioritizing patient navigation to screening colonoscopy, assuming 25% reach of eligible population and no Medicaid expansion. D: Implementation of mailed FIT-based multicomponent interventions, assuming 75% reach of eligible population and no Medicaid expansion. E: Implementation of multicomponent interventions prioritizing patient navigation to screening colonoscopy, assuming 75% reach of eligible population and no Medicaid expansion. F: Implementation of mailed FIT-based multicomponent interventions, assuming 25% reach of eligible population and Medicaid expansion. G: Implementation of multicomponent interventions prioritizing patient navigation to screening colonoscopy, assuming 25% reach of eligible population and Medicaid expansion. H: Implementation of mailed FIT-based multicomponent interventions, assuming 75% reach of eligible population and Medicaid expansion. I: Implementation of multicomponent interventions prioritizing patient navigation to screening colonoscopy, assuming 75% reach of eligible population and Medicaid expansion. Maps can help to guide decision-making about where and how to best invest limited resources to improve health outcomes. These maps can help to assess the potential impact of various combinations of approaches for increasing CRC screening at the population level by region, all of which have important cost and resource implications. b. Value frontier based on multicomponent CRC screening intervention implementation costs over 5 years. This figure, which is shown for illustrative purposes, compares the incremental number of age-eligible North Carolina residents up-to-date (UTD) on CRC screening (x-axis) and the incremental implementation costs (y-axis) for multicomponent intervention scenarios after 5 years. The incremental cost-effectiveness ratios (ICERs) are reported for each scenario above the data point. Cost and effectiveness estimates are based on prior CRC screening intervention studies [20, 56–76]. Costs of screening tests and required follow-up are excluded. We assumed the level of reach that would be feasible for each intervention scenario. The target population for the scenarios includes all age-eligible state residents, except for one scenario which only reaches Medicaid enrollees

