Figure 3.

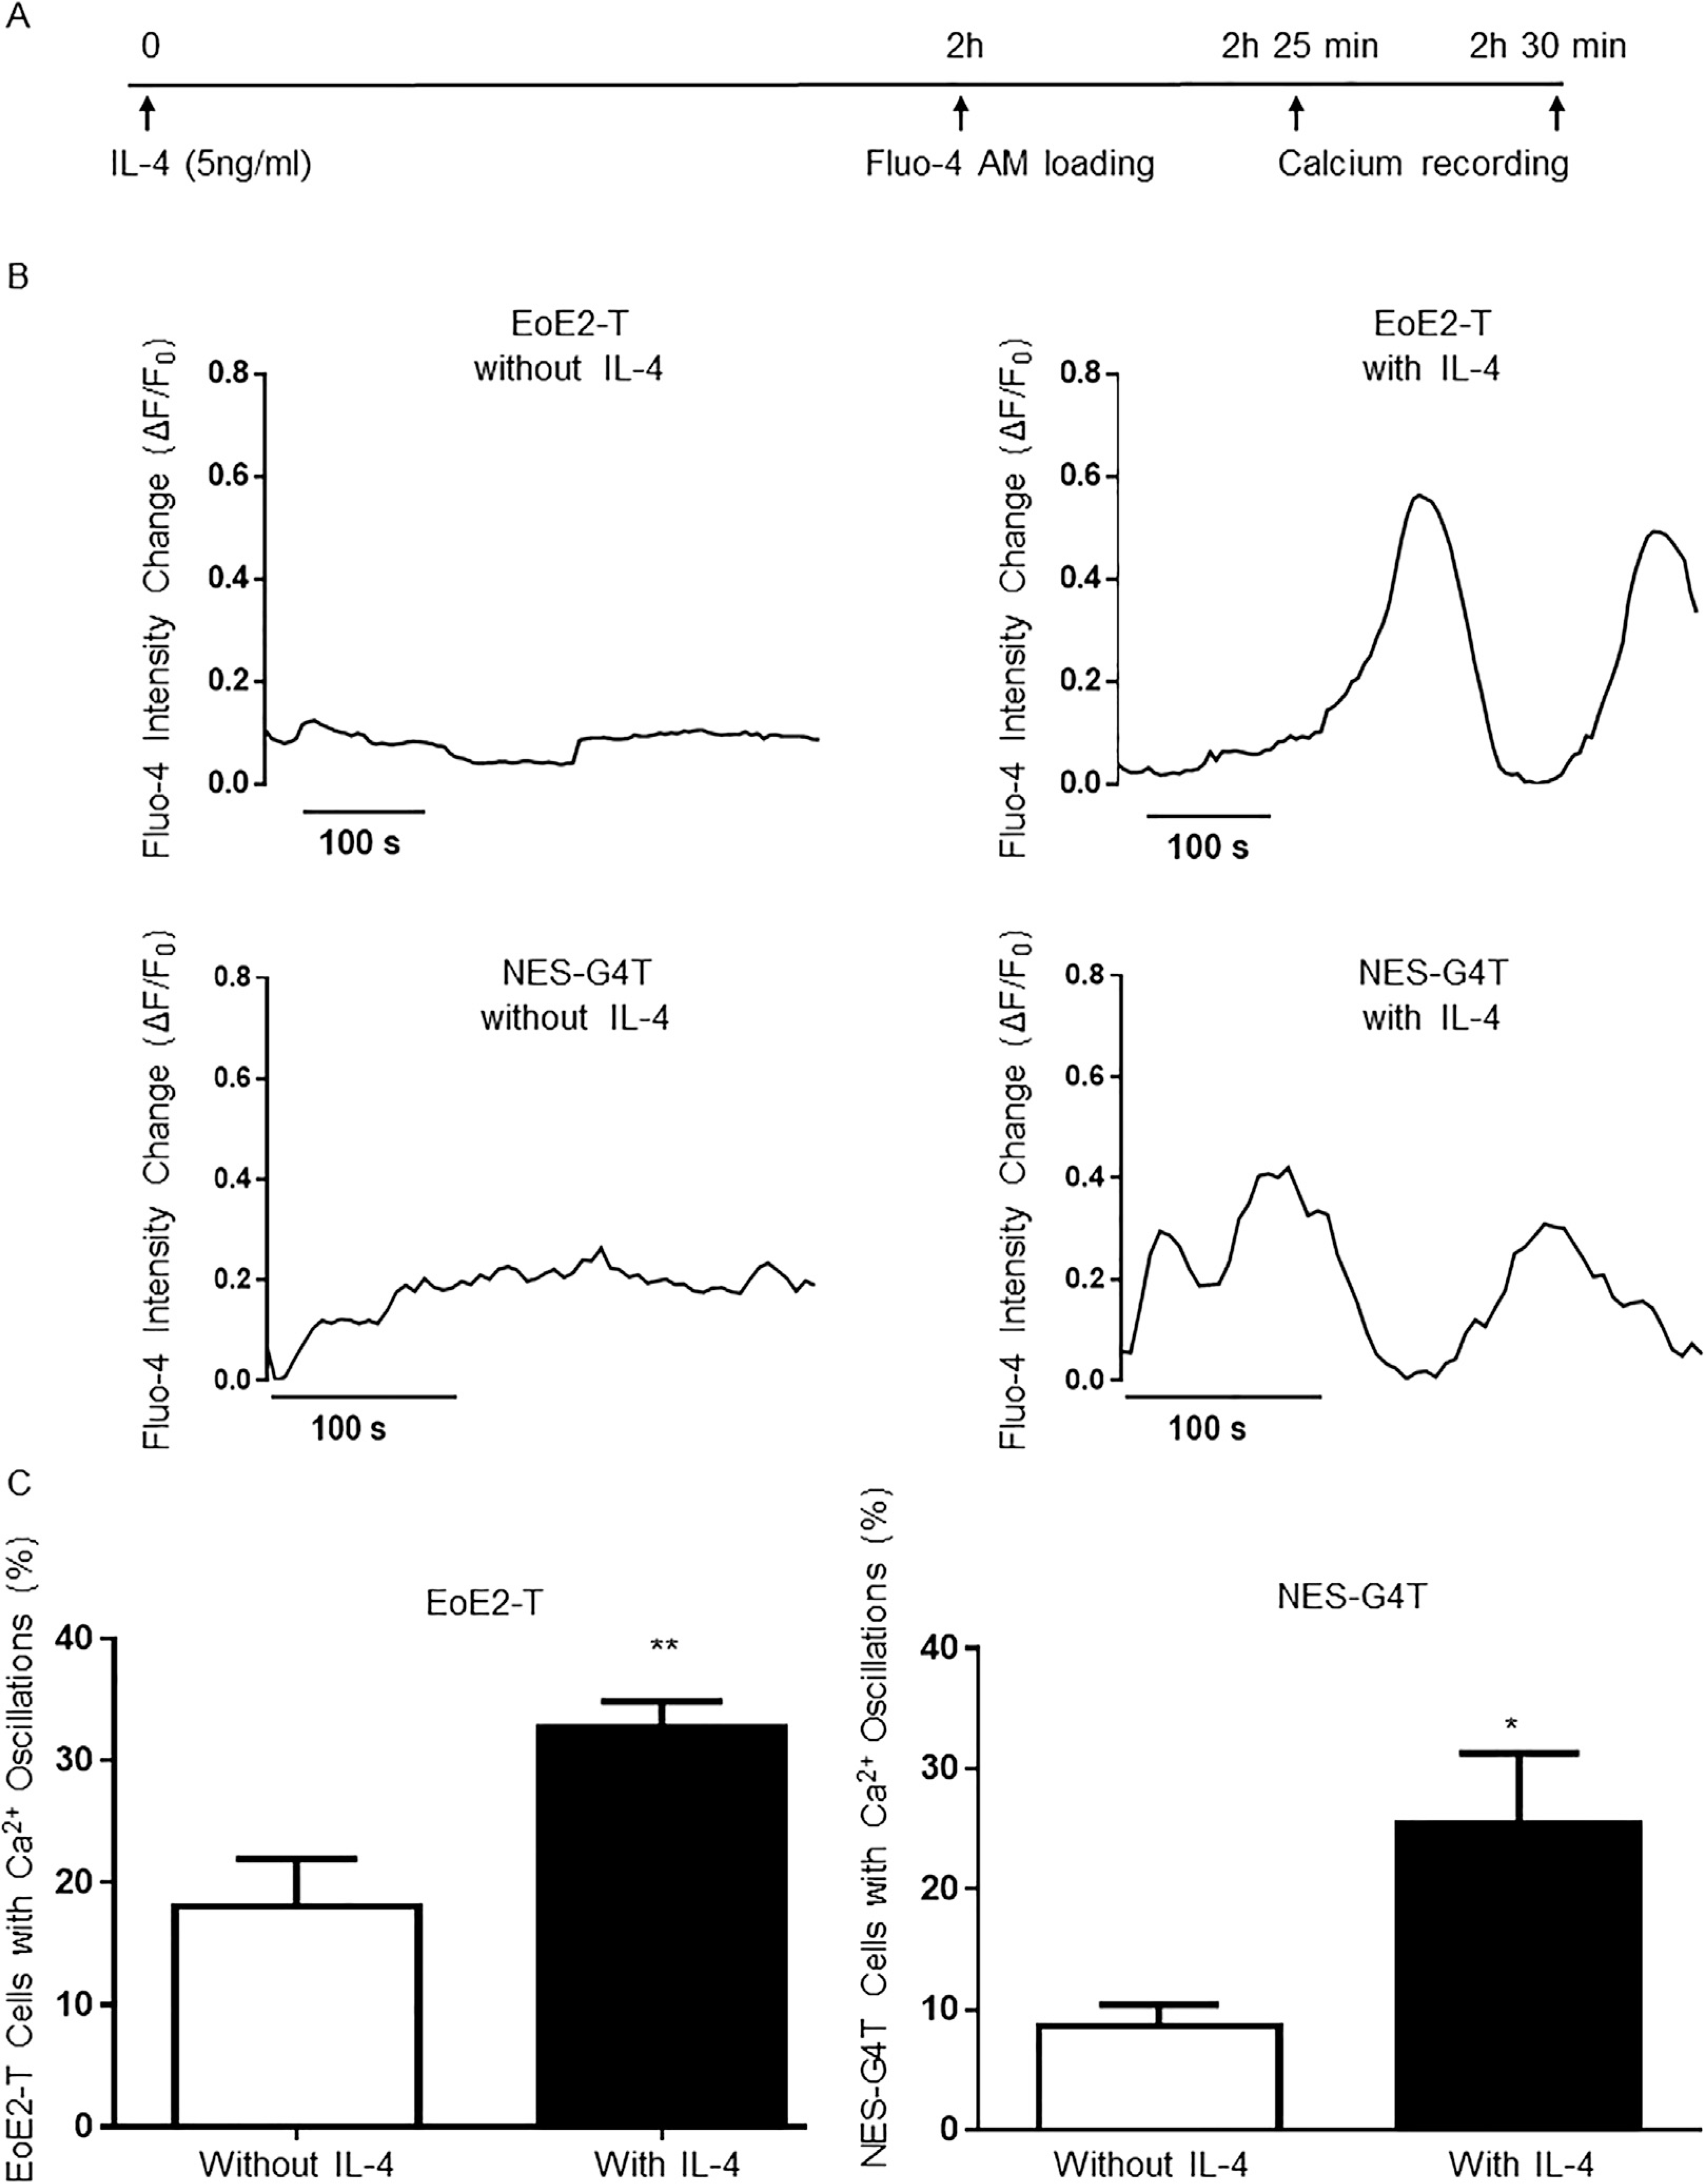
IL-4 induces intracellular calcium oscillations in EoE2-T and NES-G4T cells. (A) Diagram of the experimental protocol. (B) Representative curves of intracellular calcium oscillations (measured as changes in Fluo-4 fluorescence [ΔF/F0]) in single EoE2-T and NES-G4T cells without and with IL-4 treatment. Time scale bar: 100 seconds. (C) Percentage of EoE2-T and NES-G4T cells with calcium (Ca2+) oscillations without and with IL-4 treatment. Bar graphs depict the mean ± SEM from 2 independent experiments, with at least 5 views. **P < .01; *P < .05 compared with non–IL-4 treated cells; unpaired Student t test.
