
Figure 4.
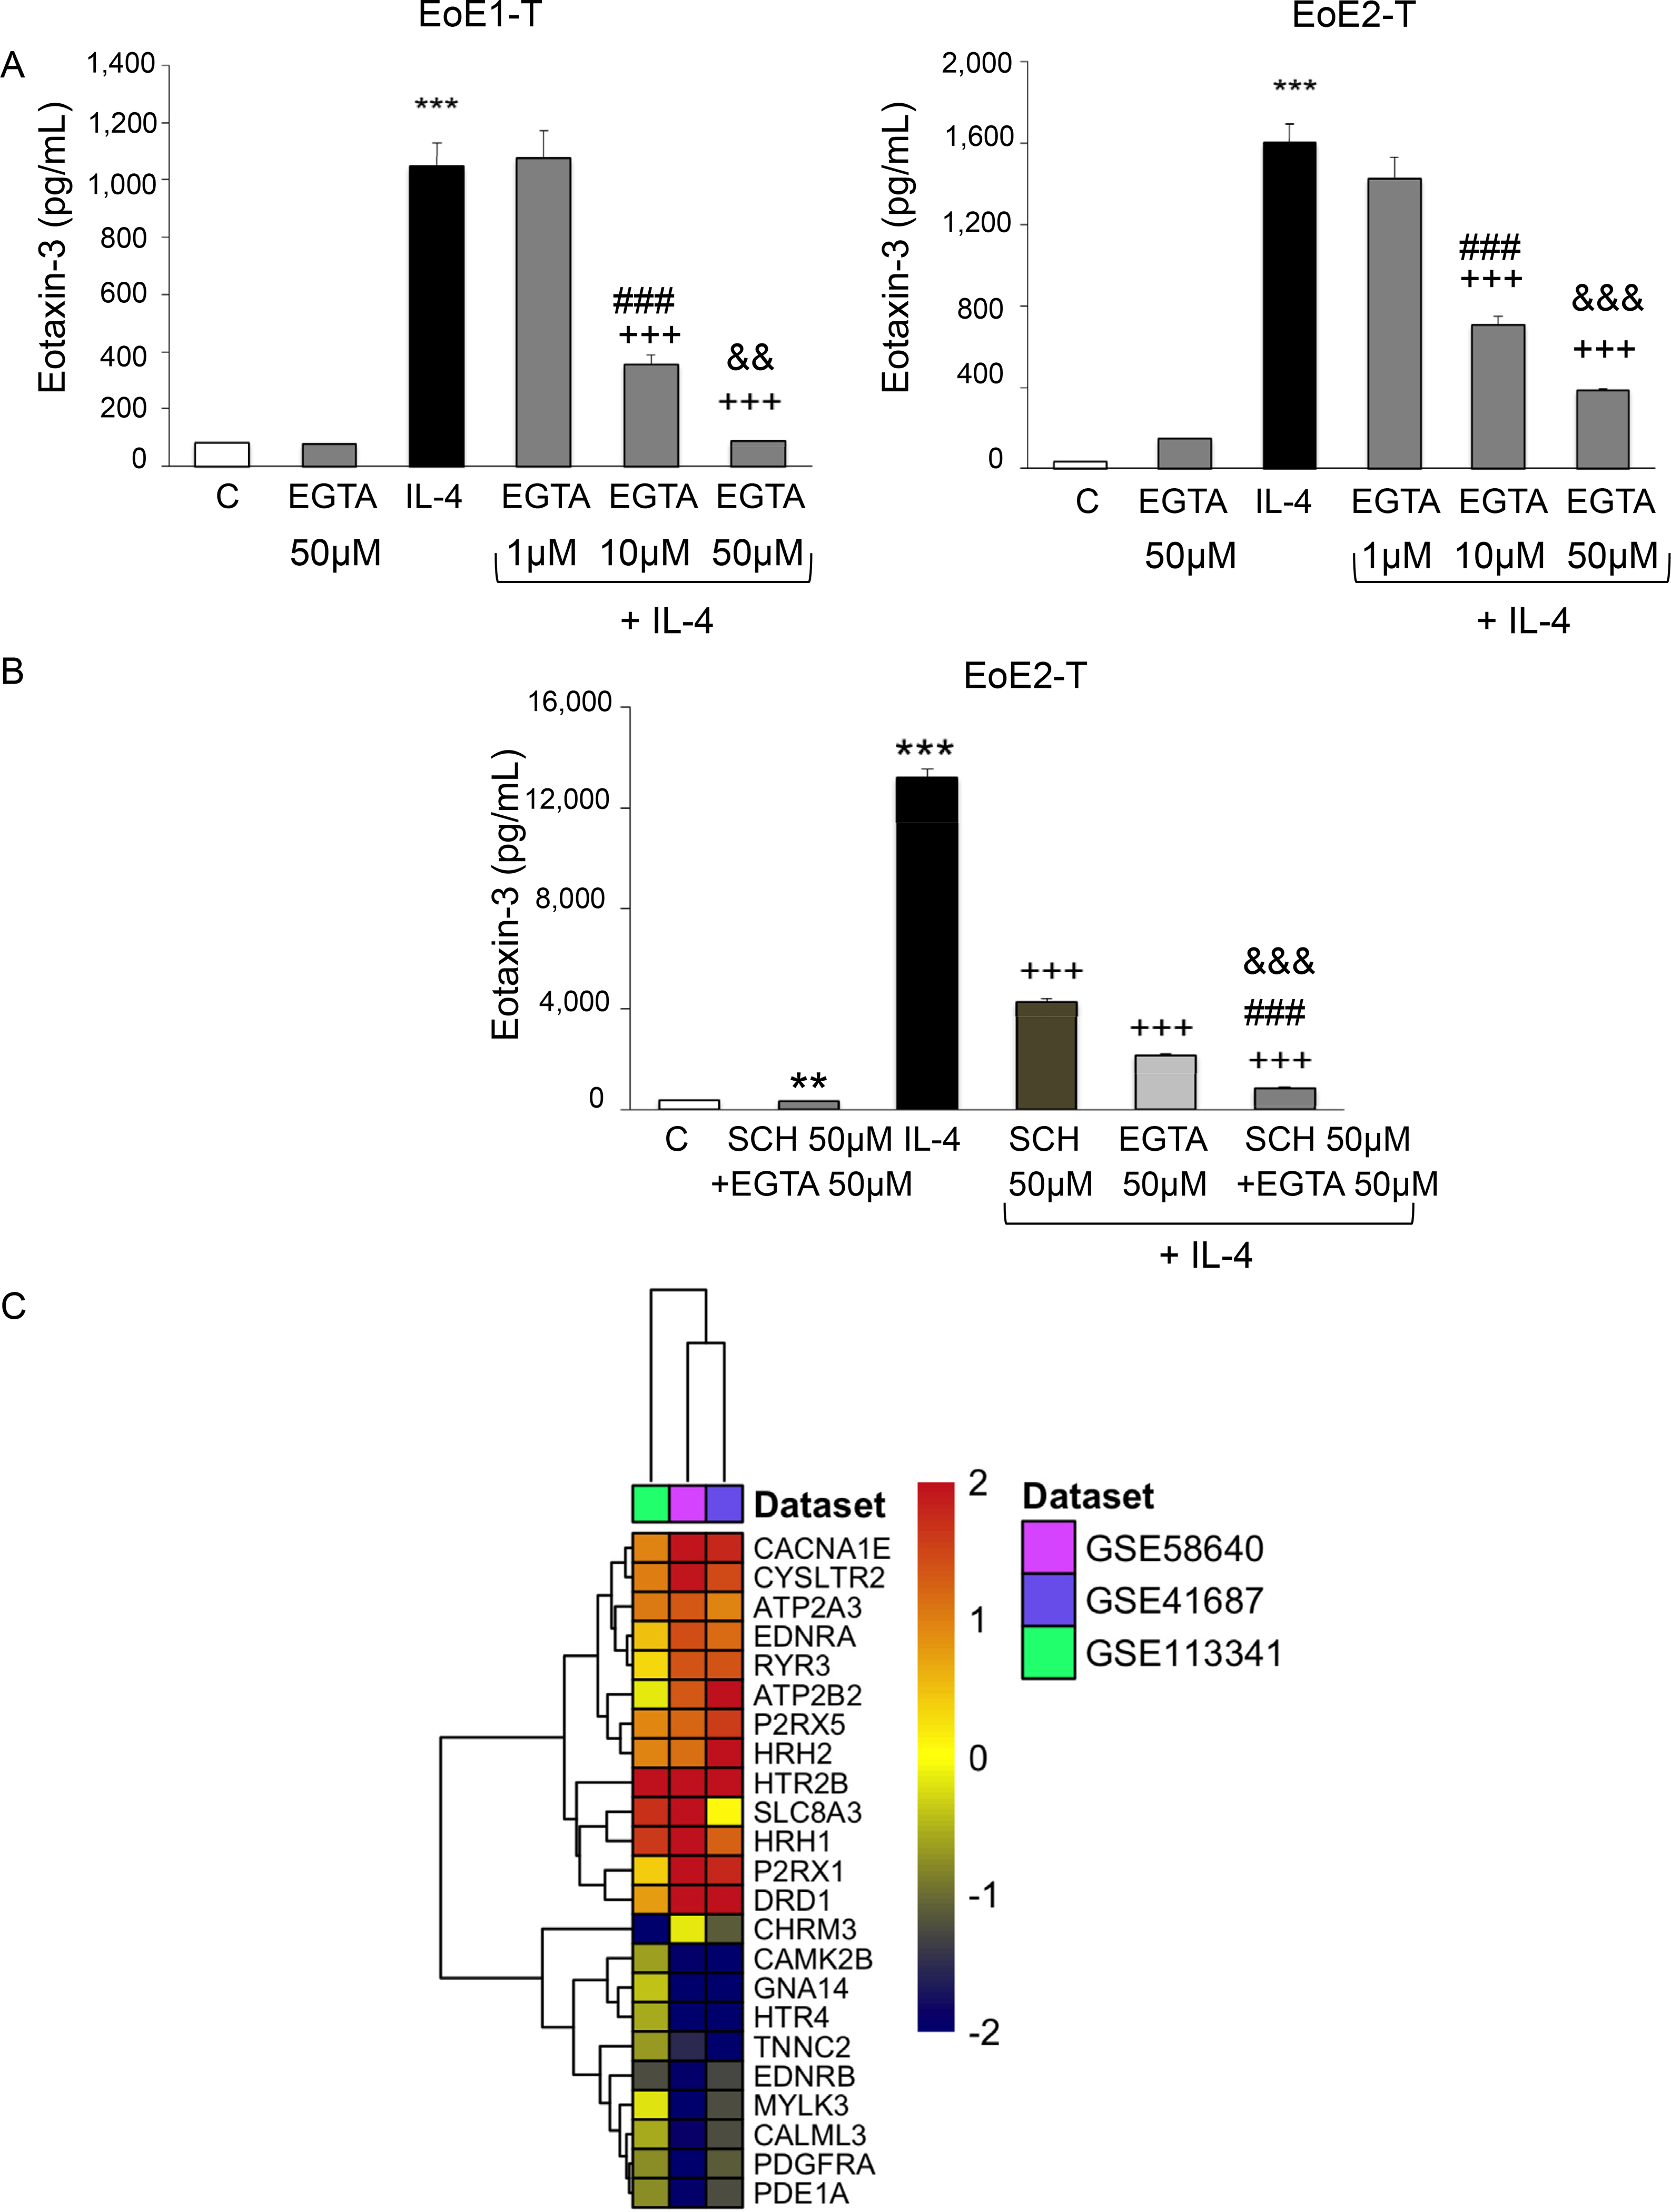
Intracellular calcium chelation by EGTA decreases IL-4–stimulated eotaxin-3 secretion in a dose-dependent fashion in EoE cells. (A) Representative eotaxin-3 enzyme-linked immunosorbent assays (ELISA) 48 or 24 hours after IL-4 treatment in EoE-1T or EoE2-T cells, respectively, with and without EGTA. Bar graphs depict the mean ± SEM from 3 separate samples. ***P ≤ .001 compared with control; +++P ≤ .001 compared with IL-4; ###P ≤ .001 compared with IL-4 + EGTA 1 μM; &&P ≤ .01, &&&P ≤ .001 compared with IL-4 + EGTA 10 μM; 1-way analysis of variance. (B) The combination of SCH 28080 (SCH) with EGTA results in significantly greater suppression of IL-4–stimulated eotaxin-3 secretion in EoE2-T cells than either agent alone. Representative eotaxin-3 ELISA assays 24 hours after IL-4 treatment in cells with and without SCH 28080 and/or EGTA. Bar graphs depict the mean ± SEM from 3 separate samples. **P ≤ .01, ***P ≤ .001 compared with control; +++P ≤ .001 compared with IL-4; ###P ≤ .001 compared with IL-4 + SCH 50 μM; &&&P ≤ .001 compared with IL-4 + EGTA 50 μM; 1-way analysis of variance. (C) Heatmap analysis of 23 differentially expressed genes in the Kyoto Encyclopedia of Genes and Genomes calcium signaling pathway; data are from 3 RNA sequencing databases (GSE58640, GSE41687, and GSE113341) comparing mucosal biopsies of 23 patients with EoE with those of 21 controls. Red or blue color corresponds to up- or down-regulation of gene expression in patients with EoE compared with controls, respectively.