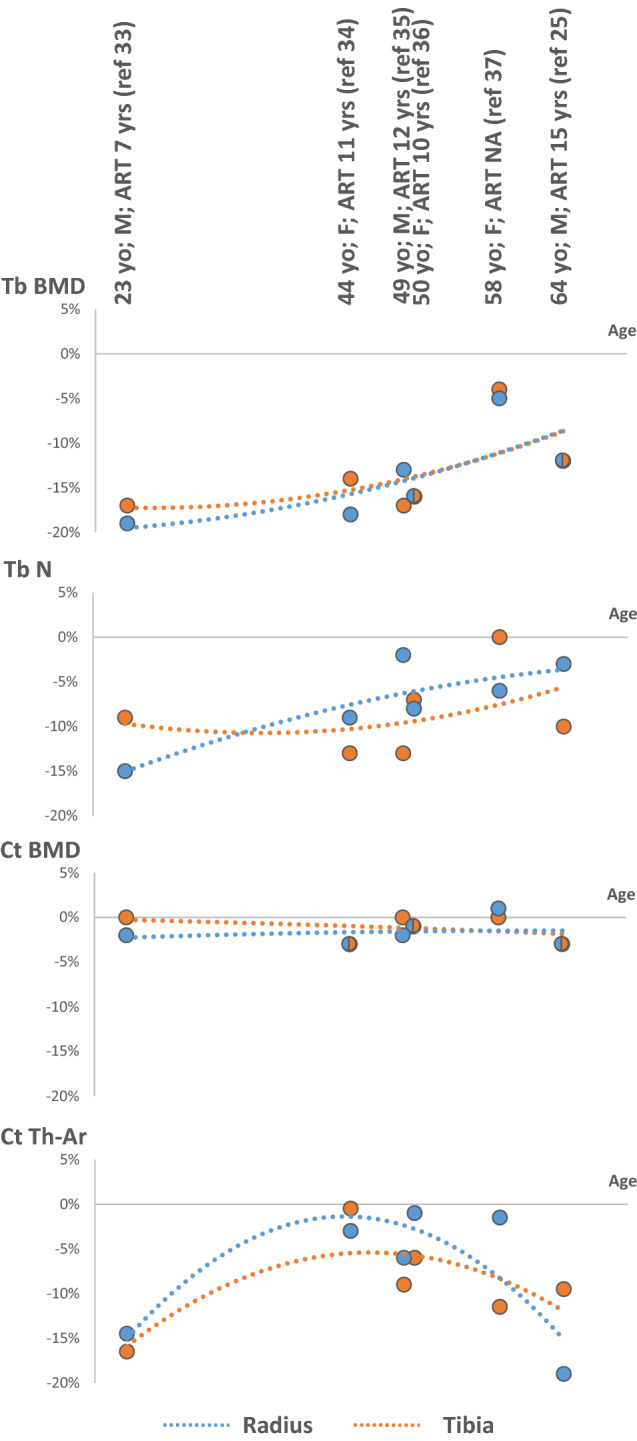
Fig. 2.

Difference (%) in trabecular and cortical BMD and microarchitecture at the distal radius and tibia between HIV and controls groups in cross-sectional studies, according to age. Sex of the study populations and duration of ART use are indicated (when available). Adapted from Refs. [25, 33–37]. M men, F women, ART antiretroviral therapy, yo years old, yrs years, Tb trabecular, Ct cortical, BMD bone mineral density, N number, Ar area, Th thickness, NA not available
