Fig. 3.
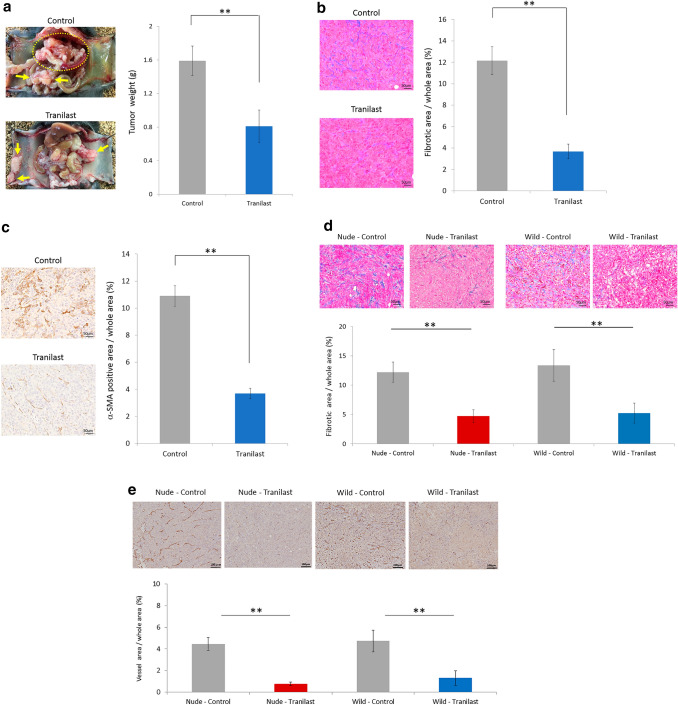
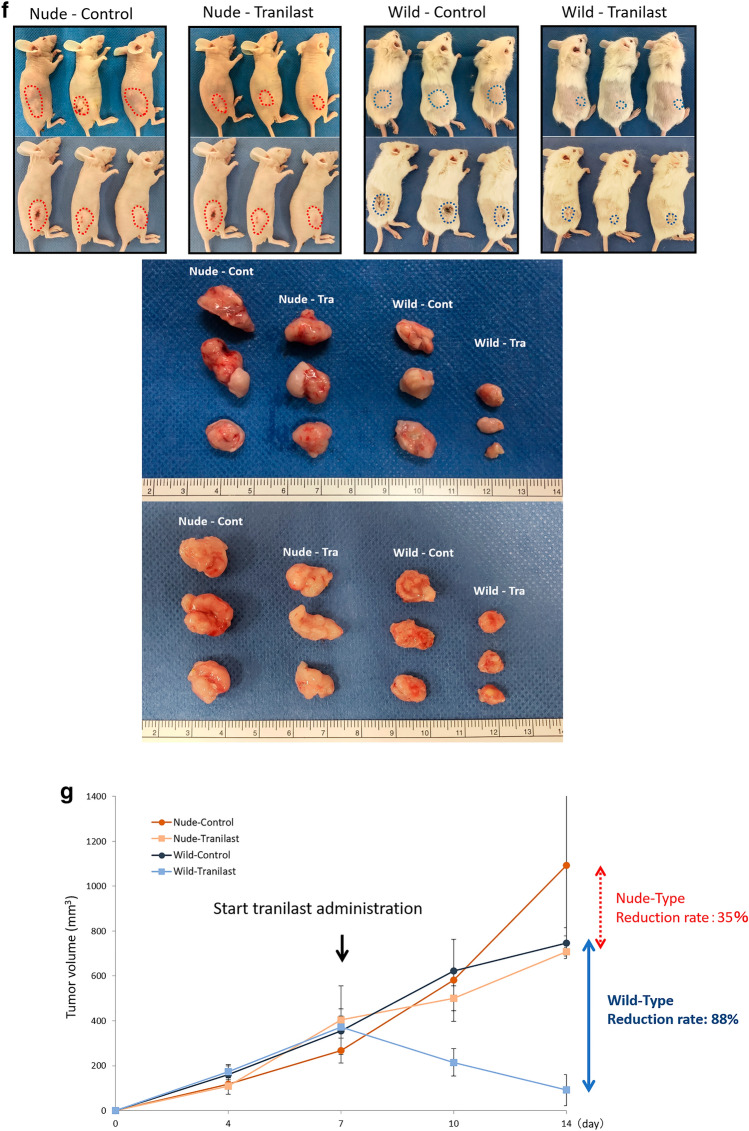
The anti-tumor effects of Tranilast administration using a mouse allograft model. a Representative macroscopic views of peritoneal nodules (arrows & circle) showing the two patterns in the control and Tranilast-treated allograft models on day 21. Results are expressed as the mean ± SEM (n = 6, **p < 0.01). Microscopic views of peritoneal tumors. Fibrotic tissues were determined by Azan staining (b) and immunohistochemical examination of α-SMA (c). Fibrotic area and α-SMA-positive area were measured and are shown as a percentage (fibrotic area, α-SMA-positive area, or whole section area). Data are expressed as the mean ± SEM of five representative regions at × 200 high-power magnification (n = 6, **p < 0.01). d Microscopic view of subcutaneous tumors. Fibrotic tissue was determined using Azan staining. Data are expressed as the mean ± SEM of five representative regions at × 200 high-power magnification (n = 6, **p < 0.01). e Vessel area was determined using CD31 immunostaining. Data are expressed as the mean ± SEM of five representative regions at × 100 high-power magnification (n = 6, **p < 0.01). f Macroscopic image of the subcutaneous tumor (six mice in each group). Tra Tranilast, Cont control. g The mean volume of the subcutaneous tumors co-inoculated with YTN16 and LmcMF cells was evaluated until 14 days after inoculation (n = 6). In wild-type BALB/c mice, the reduction rate in the Tranilast-treated group was 88%, while in nude BALB/c mice, the reduction rate in the Tranilast-treated group was only 35%


