Fig. 4.
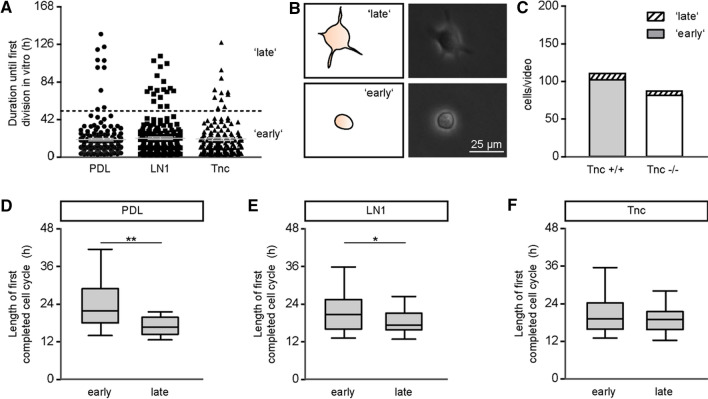
Late-dividing stem cells are a veritable subpopulation in primary SEZ cultures. a The graph presents the duration until the first division in vitro for every mother cell of the wild type dataset, separately plotted for the three substrate conditions PDL (n = 171, N = 5), LN1 (n = 185, N = 5) and Tnc (n = 141, N = 5). Gray lines represent mean ± s.e.m. The scatter of data points revealed a gap around 50 h of documentation. This boundary was used to define a threshold (black dotted line) that separates a subset of 10% of the dividing cells from the majority located underneath the threshold. b A morphological examination of both populations presented as scheme (left) and in phase contrast images (right) indicates that the ‘late’-labelled aNSPClate subpopulation possesses larger cell bodies with outgrowing branches (top) in comparison to the ‘early’-labelled mitotic aNSPCearly cells with a phase-bright round cell body (bottom). Scale bar: 25 µm. c Bar chart illustrating the diverging fractions of early- and late-dividing cells in wild type and Tnc-deficient cultures. Independently of the genotype, late-dividing aNSPCslate represented a minority of less than 10% of the dividing cells in the SEZ cultures. d–f Comparing the length of the first completed cell cycle between early- and late-dividing wild type cells indicated a significant decrease in the cell cycle of late-dividing cells on PDL (d) and LN1 (e), but not on Tnc (f). The Mann–Whitney U test was used for statistical analysis (*p < 0.05, **p < 0.01)

