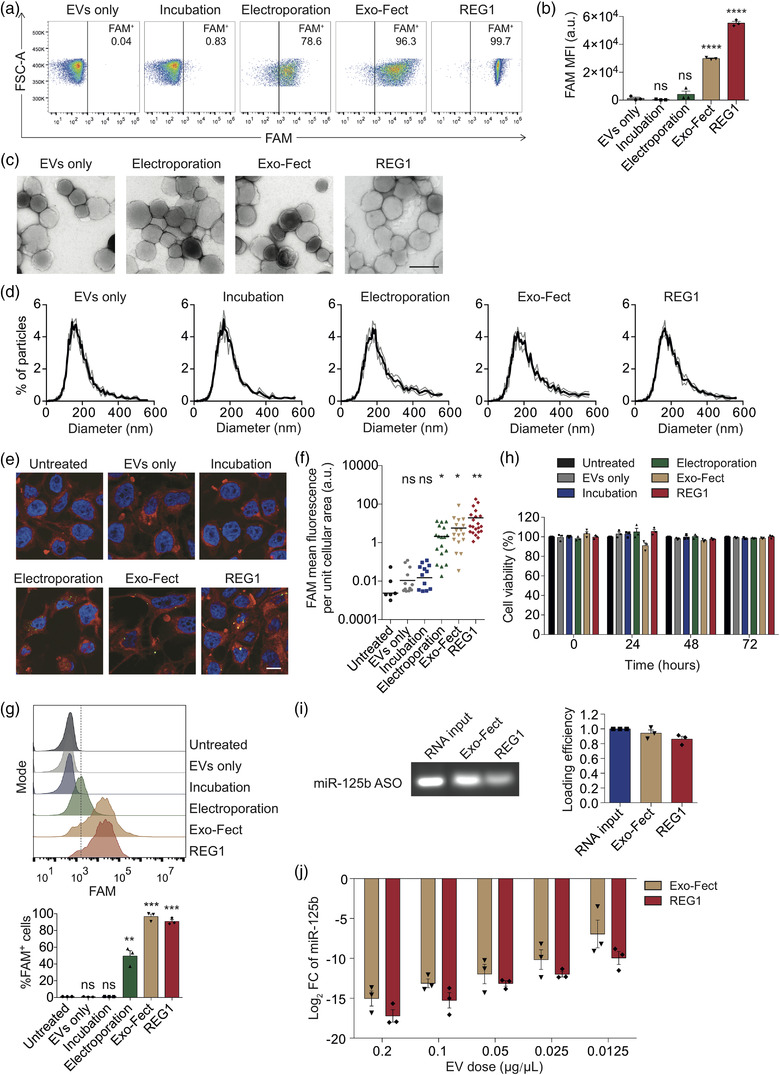
FIGURE 1.

RBCEVs can be loaded with small RNAs using multiple methods for the delivery of RNAs to cancer cells. (a) Flow cytometry analysis of RBCEVs loaded with FAM‐labelled ASO using electroporation, Exo‐Fect and REG1. As a negative control, RBCEVs were incubated with FAM‐ASO without electroporation or loading reagents. (b) Average mean intensity of FAM in RBCEVs loaded with FAM‐labelled ASO using electroporation, Exo‐Fect and REG1 (n = 3), compared to the EVs only condition for statistical analysis. (c) Transmission electron microscopy images of FAM‐ASO‐loaded RBCEVs. Scale bar, 200 nm. (d) Size distribution of FAM‐ASO‐loaded RBCEVs, determined using ZetaView® nanoparticle tracking analyzer. (e) Representative immunofluorescent images of CA1a cells taking up FAM‐ASO in RBCEVs. Nuclei were stained with Hoechst (blue). Plasma membranes were stained with CellMask Deep Red (red). Scale bar, 20 μm. (f) Average mean intensity of FAM in CA1a cells as in (e), compared to untreated control for statistical analysis. (g) Flow cytometry analysis of CA1a cells taking up FAM‐ASO‐loaded RBCEVs (n = 3), compared to untreated control for statistical analysis. (h) Viability of human breast cancer CA1a cells treated with 0.05 μg/μl NC‐ASO‐loaded RBCEVs at different time points. Viable cells were quantified by normalizing the absorbance readings to the untreated control at each time point (n = 3). (i) Loading efficiency of miR‐125b ASO in RBCEVs using Exo‐Fect and REG1, determined using gel electrophoresis (n = 3). (j) qPCR analysis of miR‐125b fold change (FC) relative to EVs only condition, normalized to U6B in CA1a cells treated with different doses of RBCEVs containing miR‐125b ASO (n = 3). All bar graphs represent mean ± SEM. ns, not significant; *p < 0.05, **p < 0.01, ***p < 0.001, and ****p < 0.0001 determined by Student's two‐tailed t‐test
