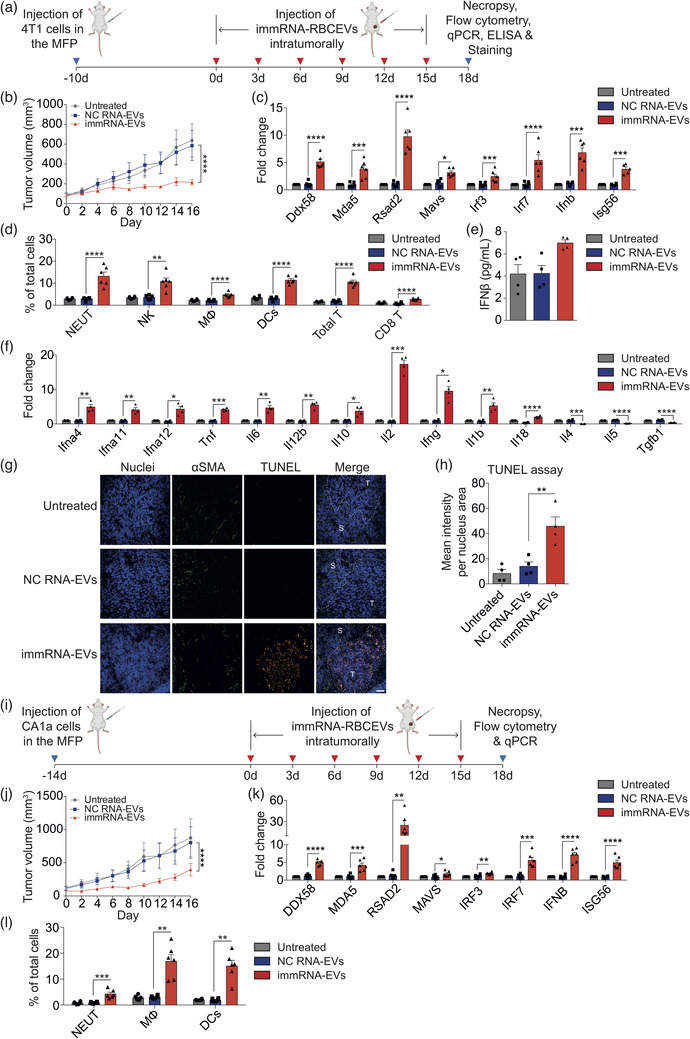
FIGURE 4.

Intratumoral delivery of immRNA suppresses breast cancer growth by triggering RIG‐I mediated immune responses. (a) Schematic treatment of mouse 4T1 mammary tumours in BALB/c mice with intratumoral delivery of immRNA in RBCEVs. (b) Volume of 4T1 tumours injected intratumorally with 2.5 mg/kg RBCEVs containing immRNA or NC RNA every three days (n = 6 mice). (c) qPCR analysis of the RIG‐I pathway gene expression relative to Gapdh in untreated and treated 4T1 tumours (n = 6 mice). (d) Flow cytometry analysis of immune cells in untreated and treated 4T1 tumours (n = 6 mice), presented as the average percentage of each subset in total cells. NEUT, neutrophils; NK, natural killer cells; MΦ, macrophages; DCs, dendritic cells. (e) ELISA quantification of IFNβ in the sera of mice with 4T1 tumours (n = 4 mice). (f) qPCR analysis of cytokine gene expression relative to Gapdh in untreated and treated 4T1 tumours (n = 4 mice). (g) Representative images of TUNEL staining (orange fluorescence) of untreated and treated 4T1 tumour sections. Cancer‐associated fibroblasts (green) were stained with anti‐αSMA antibody. Nuclei were stained with Hoechst (blue). Scale bar, 50 μm. T, Tumour; S, Stroma. (h) Average mean intensity per nucleus area of TUNEL staining signals (n = 4 mice). (i) Schematic treatment for human CA1a mammary tumours in NSG‐SGM3 mice with intratumoral delivery of immRNA‐loaded RBCEVs. (j) Volume of CA1a tumours injected intratumorally with 2.5 mg/kg RBCEVs loaded with immRNA or NC RNA every three days (n = 6 mice). (k) qPCR analysis of RIG‐I pathway gene expression relative to GAPDH in untreated and treated CA1a tumours (n = 6 mice). (l) Flow cytometry analysis of immune cells in untreated and treated CA1a tumours (n = 6 mice). All bar graphs represent mean ± SEM. *p < 0.05, **p < 0.01, ***p < 0.001, and ****p < 0.0001 determined by Student's two‐tailed t‐test
