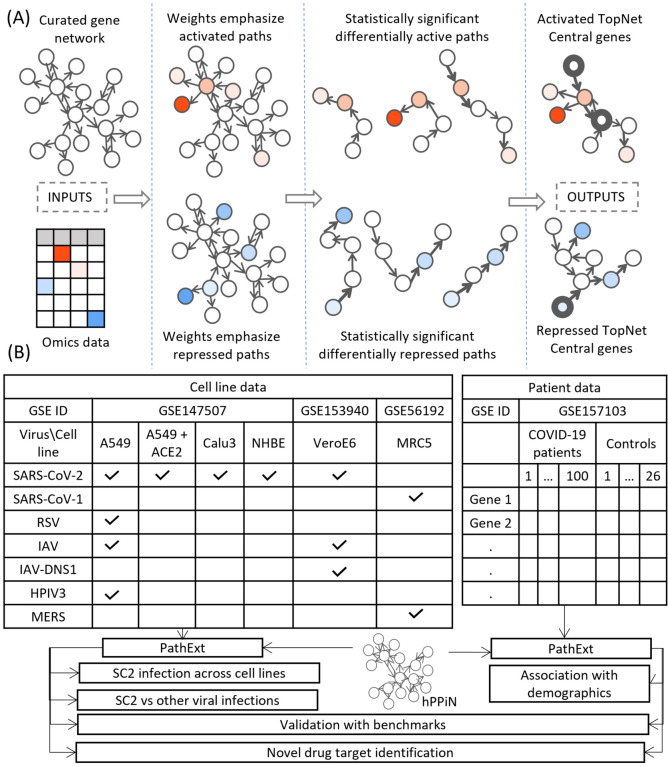
Figure 1: Study Workflow.
(A) Our PathExt tool accepts as input a curated gene network and gene expression data, to output two weighted sub-networks - an activated and a repressed TopNet comprising activated and repressed paths respectively, and a list of central genes in each TopNet. Activated genes are shown here in shades of red, and repressed genes are in shades of blue. PathExt integrates the inputs such that edges connecting genes with substantial change in expression are preferentially traversed by a shortest paths algorithm (Methods), illustrated here using wider arrows. Shortest paths which are statistically significant (permutation based) now represent differentially active (or repressed) paths and make up the TopNets in which PathExt identifies central genes based on ripple centrality. (B) We apply PathExt to analyze RNa-seq data from SARS-CoV-2 infection in both cell lines and patient PBMC data. PathExt outputs from the cell line data are used to compare cross-cell-line variation in SC2 infection response, and within-cell-line variation in response to other viruses. In patient PBMC data, we identify associations between PathExt results and demographics. We then validate all the results against benchmarks and use the TopNets and central genes to propose novel drug targets, as well as novel drugs for known targets.

