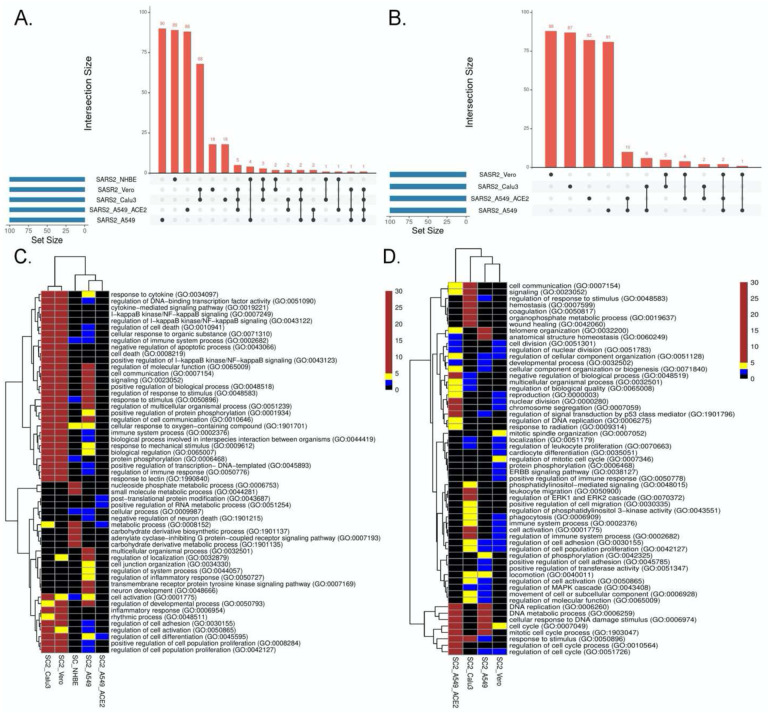
Figure 2: SC2 infection across cell lines.
We analyzed the transcriptional response across various cell lines post SC2 infection. We obtained the top100 central genes from each cell line for both TopNets (activated & repressed) and compared the gene commonality across cell lines as shown in upset plots for activated TopNets (Fig. 2A) and repressed TopNets (Fig. 2B). Next, we performed gene enrichment analysis and compared the top 10 parent GO terms enriched in various cell lines for activated TopNets (Fig. 2C) and repressed TopNets (Fig. 2D). Here we show only those GO terms that were significant in at least 2 cell lines. Complete list of enriched GO terms is provided in the supplementary tables. Heatmap is created by converting the FDR corrected p-value of each GO terms to −log10 scale. Significance of the terms is shown in various color ranges (0–1.3, 1.3–2.0, 2–5 and >5–30). All the non-significant processes are shown in black (value <1.3).

