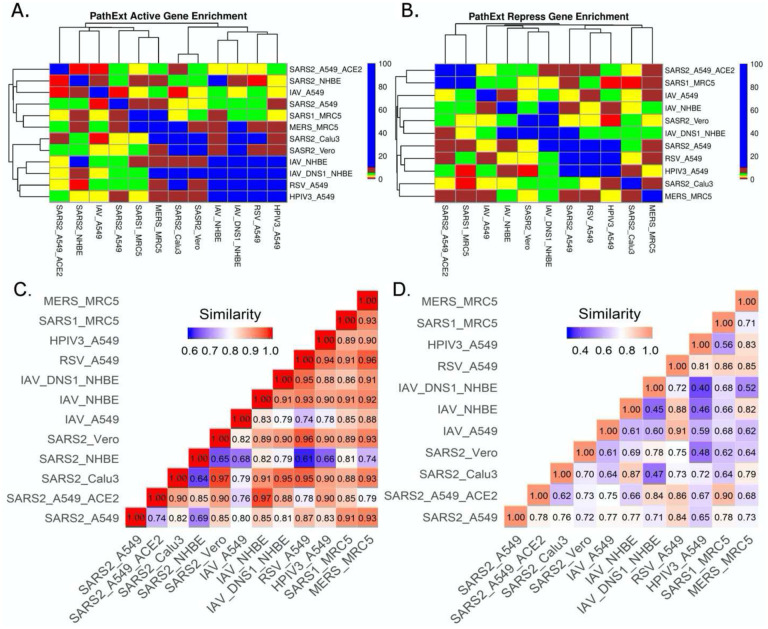
Figure 3: SC2 infection comparison with other viruses.
We analyzed the transcriptional response to different viruses including SC2 in various cell lines. We obtained the top 100 central genes from each cell line for activated & repressed TopNets and compared the gene commonality across various viruses in different cell lines as shown in gene enrichment plot (Observed/Expected overlap) for activated TopNets (Fig. 3A) and repressed TopNets (Fig. 3B). Semantic similarity among the enriched biological processes observed in different viruses activated and repressed networks (Fig. 3C&D respectively) shows higher similarity.

