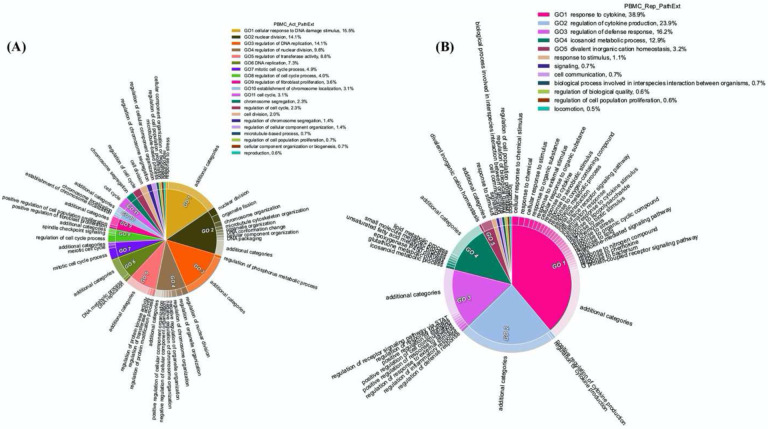
Figure 5: Functions enriched among central TopNet genes in patient PBMCs.
Most frequent top 100 central genes were obtained from the activated and repressed networks across patient PBMC data. Enriched biological processes were obtained by performing Gene Ontology study followed by parent child relationship, shown in the form of circular visualization plot for activated TopNet (A) and repressed TopNet (B).

