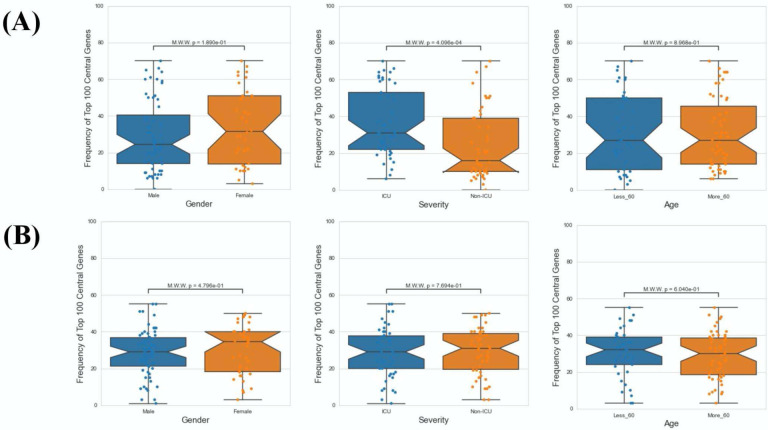
Figure 6: Demographic features analysis.
Mann Whitney Test was performed to check statistical significance between top 100 central genes and various demographic features (age, sex and severity). In case of PathExt identified top genes, “Severity” was found to be the only statistically group among activated TopNet genes (A). However, no group was statistically significant in case of repressed TopNet (B).

