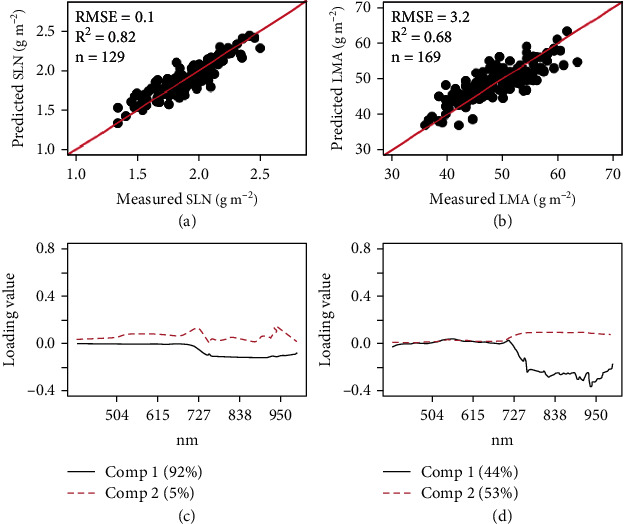
Figure 5.

Cross-validated predictions of SLN (a) and LMA (b) and corresponding loadings with principal components 1 and 2 for SLN (c) and LMA (d) using partial least square regression (PLSR) with reflectance values at different wavelengths between 395 and 997 nm. Note: Bottom panels (c and d) show model loadings which represent the relative importance of a given spectral wavelength in each model (a and b, respectively); values in brackets indicate the percentage of variance explained by the first two principal components.
