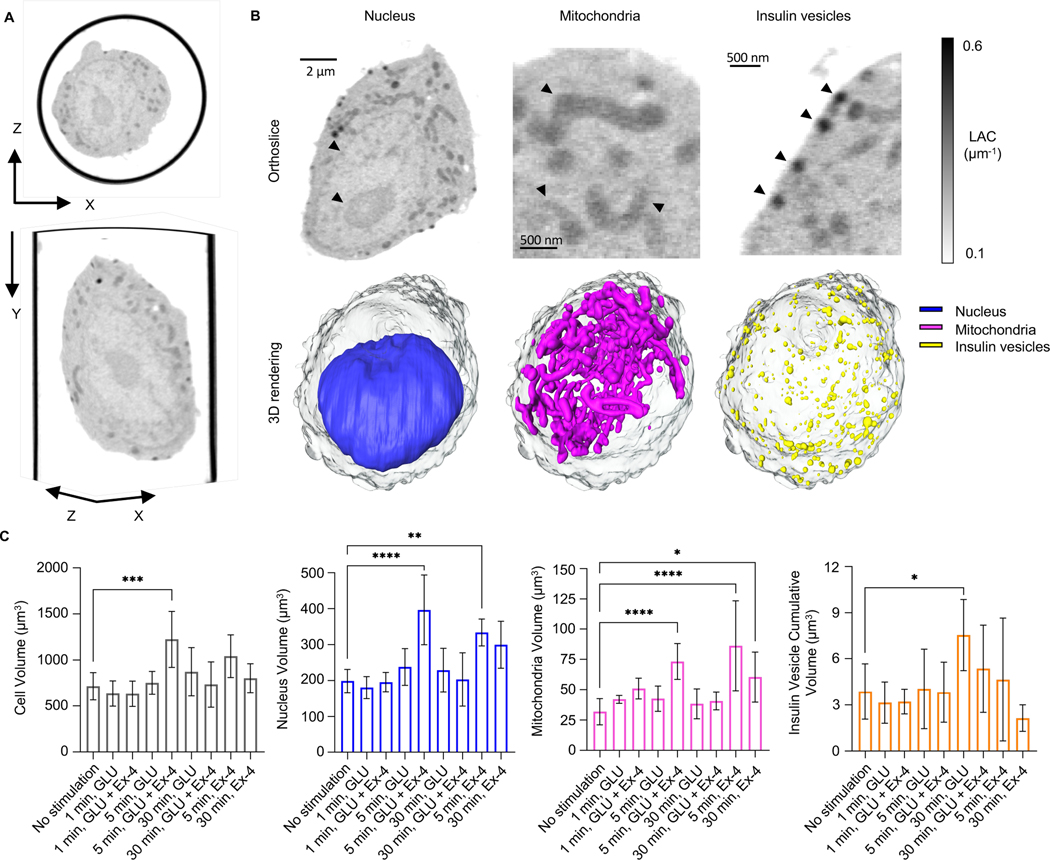
Figure 1: Isotropic reconstruction of a single pancreatic β-cell.
A) The whole cell volume is shown in the XY (bottom) and XZ plane (top). B) Organelles are imaged based on different levels of grey values, with a threshold between 0.1–0.6 μm−1. Single orthoslices (top) and relative 3D rendering (bottom) represent a single β-cell after 1 min of high glucose treatment (cell ID: 821_12). In detail, the rendering shows: nucleus (blue); mitochondrial network (magenta), and insulin vesicles (yellow) and their spatial distribution. All organelles in the orthoslices are highlighted by an arrowhead. C) Plots representing the overall volume of the organelle in the cells per condition and timepoint. We report alteration in the total volume of each type of organelles, in the following order: from left, changes in cell volume with signific difference between 5 min stimulated cells with high glucose+Ex-4 and no stimulated cells (***P=0.0002); changes in the nucleus volume with significant difference between no stimulated cells and 5 min stimulated cells with high glucose+Ex-4 (****P<0.0001), and 5 min stimulated cells with 10 nM Ex-4 (**P=0.0058); changes in the volume of the mitochondrial network with significant difference between no stimulated cells and 5 min stimulated cells with high glucose+Ex-4 (****P<0.0001), 5 min stimulated cells with Ex4 (****P<0.0001), and 30 min stimulated cells with Ex-4 (*P=0.0189); and finally, changes in the insulin vesicle cumulative volume with significant difference between no stimulated cells and 30 min stimulated cell with high glucose (*P=0.0170). Statical significance was validated using Dunnett’s multiple comparison test.

