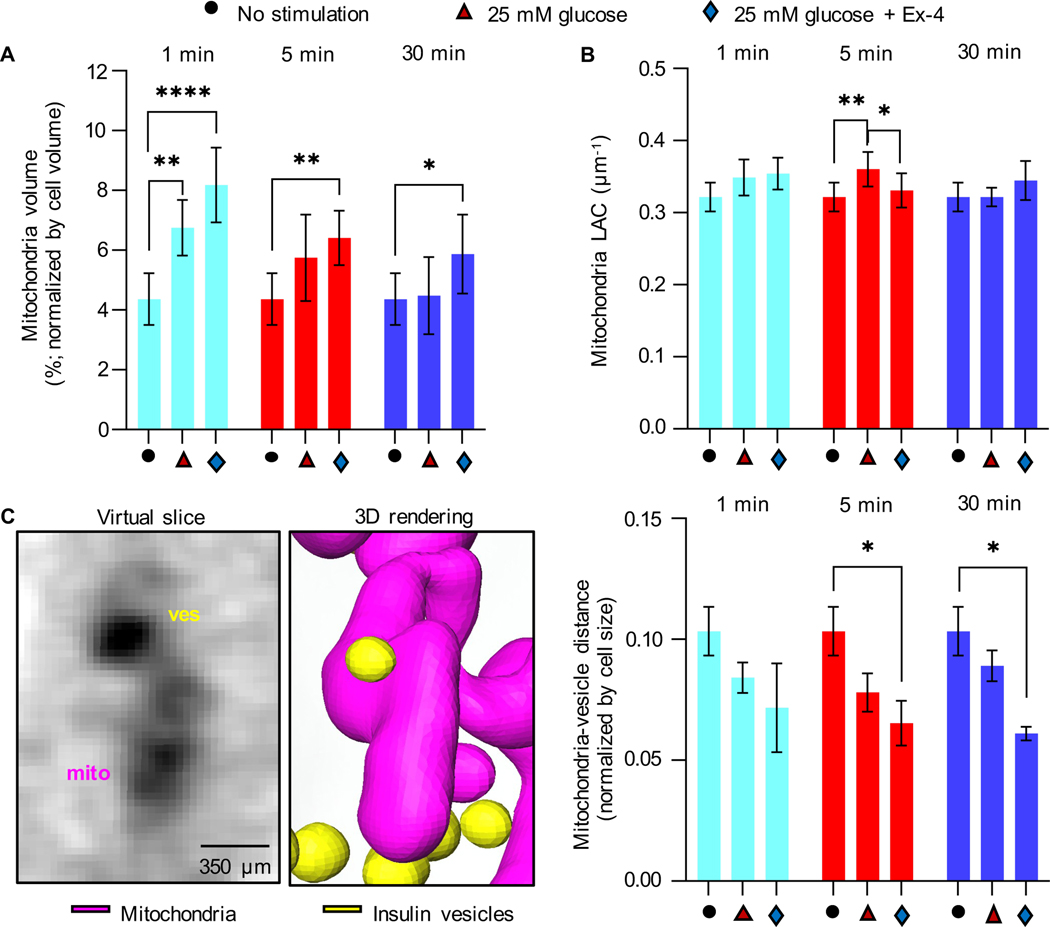
Figure 2: Effect of glucose and Ex-4 stimulation on mitochondria properties and spatial distribution.
A) Percentage of cell volume occupied by mitochondria for each condition and time point. Compared to unstimulated cells, a significant difference is observed after 1 min (****P<0.001 and **P=0.042), 5 min (**P=0.0035), and 30 min (*P=0.0460) of stimulation with high glucose±Ex-4 (Tukey’s multiple comparison test). B) Mean mitochondria LAC value. Significant difference is observed between unstimulated cells and cells stimulated with 25 mM glucose for 5 min (**P=0.0071), and between 25 mM glucose vs. 25 mM glucose+10 nM Ex-4 stimulated cells for 5 min (*P=0.0426). Statistical significance was evaluated using Tukey’s multiple comparison test. C) Left: An orthoslice and 3D rendering of interacting insulin vesicles and mitochondria after 1 min of stimulation with high glucose. Right: mean distance between insulin vesicles and mitochondria normalized by cell size shows a significant decrease in the distance between unstimulated and glucose+Ex-4 stimulated cells after 5 min and 30 min (respectively, *P=0.0269 and *P=0.0121. Tukey’s multiple comparison test). Error bars represent SDs.

