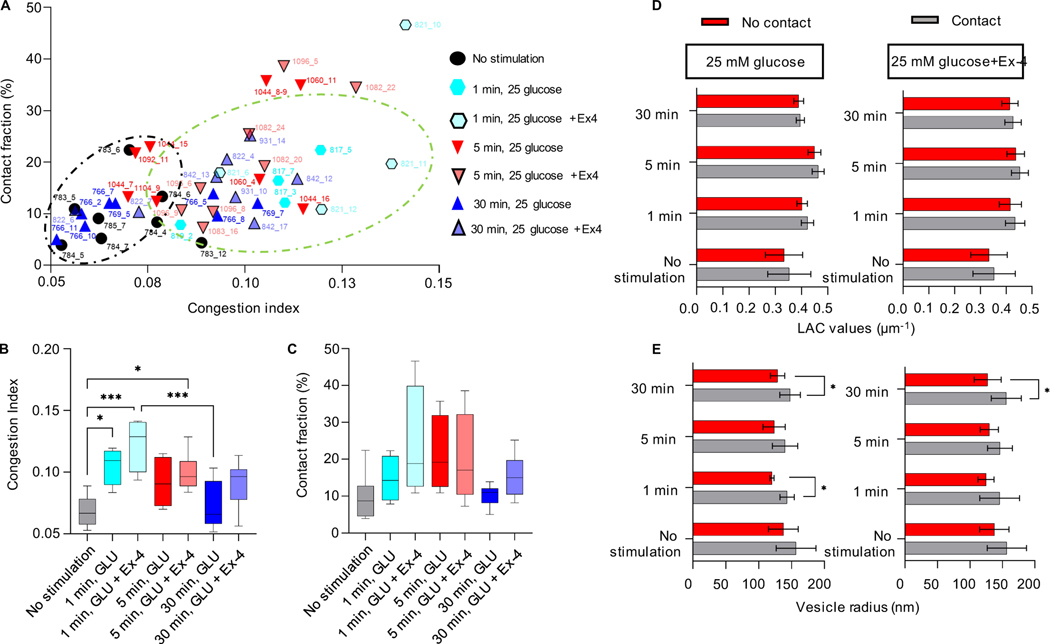
Figure 5: Analysis of the mitochondria-insulin vesicle interaction randomness.
A) The plot shows the correlation between the number of mitochondria-vesicle contacts and the congestion index (C.I.) per individual cell. The black circle shows clusters of cells with less crowding (lower C.I., 0.05–0.08) and percentage of contacts (3–12%); the green circle shows those with more crowding (higher C.I., 0.08–0.14) and percentage of contacts (425%) under different conditions. B) Mean value of the C.I. for each condition. Significant difference is reported between no stimulated cells and 1 min glucose stimulated cells (*P=0.0210), 1 min glucose+Ex-4 stimulated cells (***P=0.0002), and 5 min glucose+Ex-4 stimulated cells (*P=0.0153); significant difference is also reported between 1 min glucose+Ex-4 stimulated cells and 30 min glucose stimulated cells (***P=0.0007). C) Mean value of the faction of contacts per condition. D) Plot showing the LAC values of vesicles in contact (grey) and not in contact (red) with mitochondria, at each time point and stimulation, with no significant difference. E) Changes in the vesicle size whether in contact with the mitochondria network (grey) or not (red). The plot shows a significant difference between the size of vesicle after 1 min stimulation with glucose (143±11 nm contacts; 120±3.0 nm no contacts, *P=0.0195), 30 min stimulation with high glucose (148±16 nm contacts; 129±11 nm no contacts, *P=0.0147) and high glucose+Ex-4 (155±23 nm contacts; 127±21 nm no contacts, *P=0.0211). Error bars represent the SDs, and the statistical significance was evaluated using Welsh’s test.

