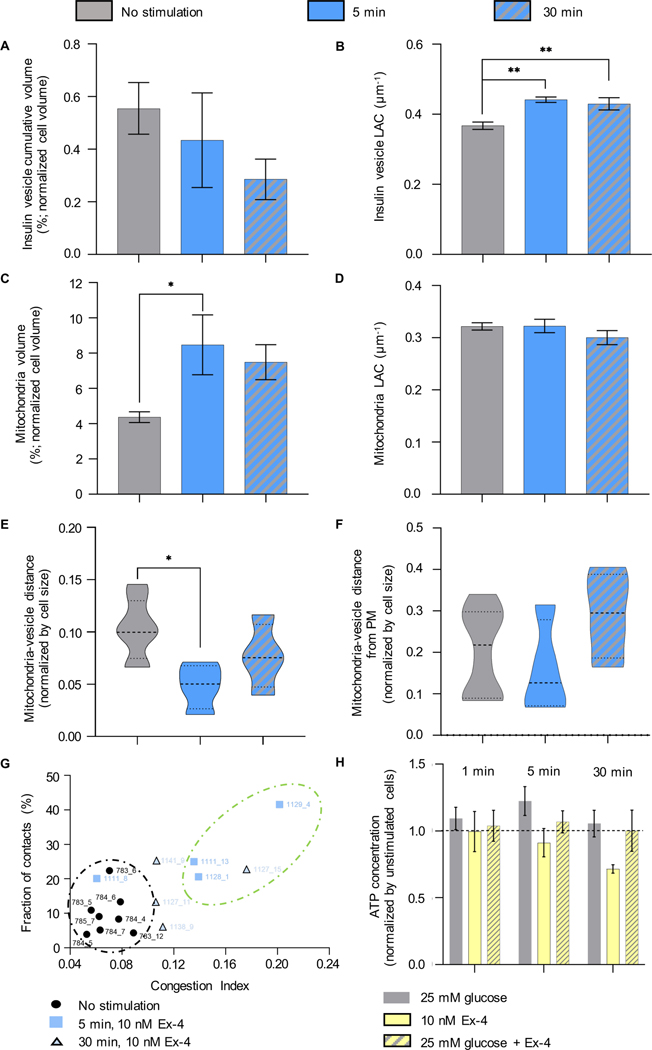
Figure 6: Effect of Ex-4 on the organelle properties.
A) Percentage of cell volume occupied by insulin vesicles in unstimulated, 5-min, and 30-min post stimulation with 10 nM Ex-4. B) LAC of insulin vesicles treated with Ex-4. Statistical significance was found between the unstimulated (0.37±0.03μm−1) and 5-min (0.44±0.02μm−1, **P=0.0026) and 30-min 0.43±0.04μm−1, **P=0.0089) post stimulation. C) Percentage of cell volume occupied by the mitochondrial network. Statistical significance was observed after stimulating the cells for 5 min with Ex-4 (8.47±3.40%, *P=0.0133), compared to unstimulated cells (4.37±0.86%). D) There were no significant differences in LAC values for mitochondria treated for 5 (0.32±0.03μm−1), and 30 min (0.30±0.03μm1) with Ex-4 compared with untreated cells (0.32±0.02μm−1). E) There was a significant difference in the mean distance between mitochondria and insulin vesicles in unstimulated cells and cells treated for 5-min (*P=0.0166). F) There was no significant difference in mitochondria-vesicle contacts at different distances from the PM (normalized by cell size) between unstimulated cells and after 5, and 30 min of stimulation. G) Correlation between C.I. and fraction of vesicles in contact with mitochondria in unstimulated cells and cells after 5-, and 30-min of stimulation with Ex-4. Two clusters are highlighted: the black circle shows cells with low C.I. (0.04–0.08) and fraction of contact; the green circle shows cells with high C.I. (0.12–0.20) and high fraction of contacts (20–42%). H) ATP concentration of cells treated with high glucose±Ex-4 and Ex-4 alone. The ATP concentration for each condition is normalized by the ATP concentration in unstimulated cells. The black line shows the distance between the ATP value in the unstimulated cells and cells treated with glucose and Ex-4. In all panels, statistical significance was evaluated using Tukey’s multiple comparison test.

