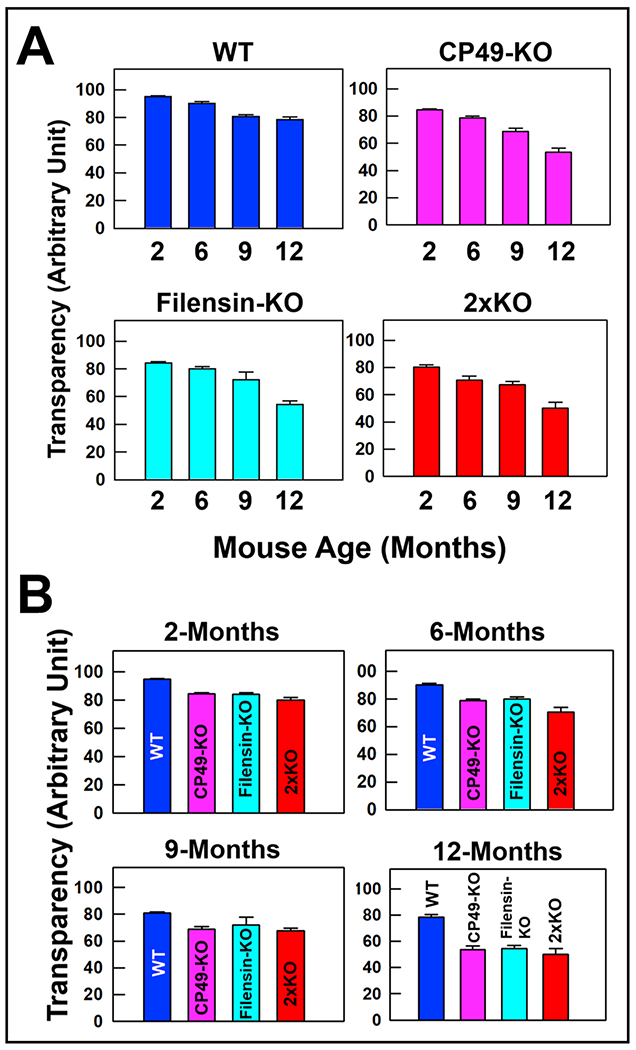
Fig. 4.

Quantification of lens transparency. Bar graph showing progressive loss of lens transparency in CP49-KO, filensin-KO and 2xKO mice compared with age-matched WT lenses. Lens transparency was calculated for (A) WT, CP49-KO, filensin-KO, and 2xKO mice at (B) 2-, 6-, 9- and 12-months of age by subtracting the pixel brightness intensity from 100. Each bar represents mean ± SD.
