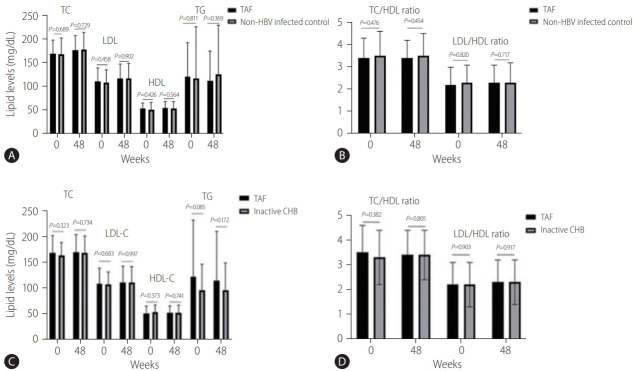
Figure 1.
Comparison of all fasting lipid profiles, TC/HDL ratio, and LDL/HDL ratio in the TAF (n=45) and non-HBV-infected control groups (n=180). (A) All fasting lipid profile (TC, LDL, HDL, and TG) changes at baseline and 48 weeks in the TAF and non-HBV-infected control groups. (B) Comparison of the TC/HDL ratio and LDL/HDL ratio in the TAF and non-HBV-infected control groups. (C) All fasting lipid profile (TC, LDL, HDL, and TG) changes at baseline and 48 weeks in the TAF and inactive CHB groups. (D) Comparison of TC/HDL and LDL/HDL ratios in the TAF and inactive CHB groups. TC, total cholesterol; LDL, low-density lipoprotein; HDL, high density lipoprotein; TG, triglyceride; TAF, tenofovir alafenamide; CHB, chronic hepatitis B; HBV, hepatitis B virus.

