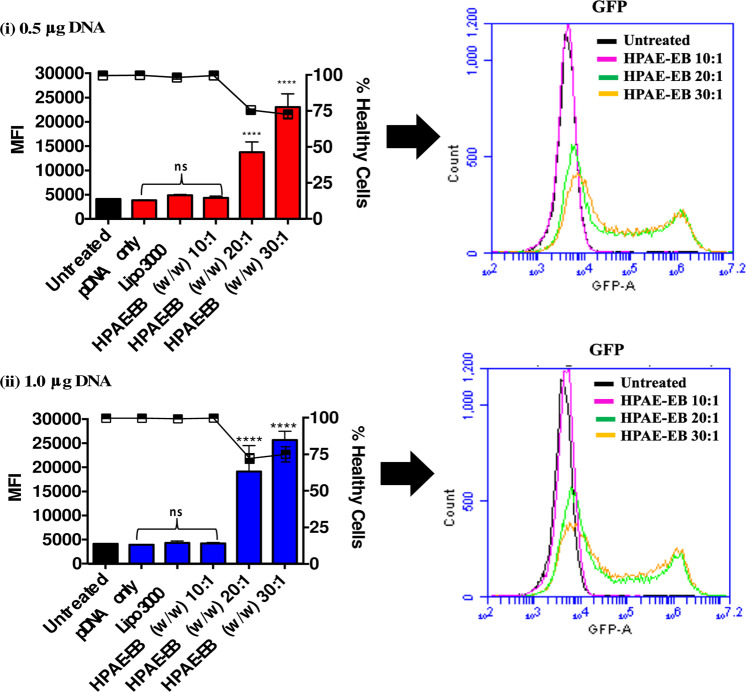
Fig. 5. Mean fluorescence intensity (MFI) and cell viability of transfected HEK293 cells.
MFI of GFP fluorescence for each transfection condition was grouped into polymer:DNA w/w ratios used and cell viability. In addition, one-plot histogram overlay of GFP fluorescence comparing untreated control and HPAE-EB transfections under different w/w ratios was performed. Only HPAE-EB at w/w ratios of 20:1 and 30:1 yields a statistically significant increase in MFI. All results are shown as mean ± SD, n = 3. ****p < 0.0001, as compared to control values.

