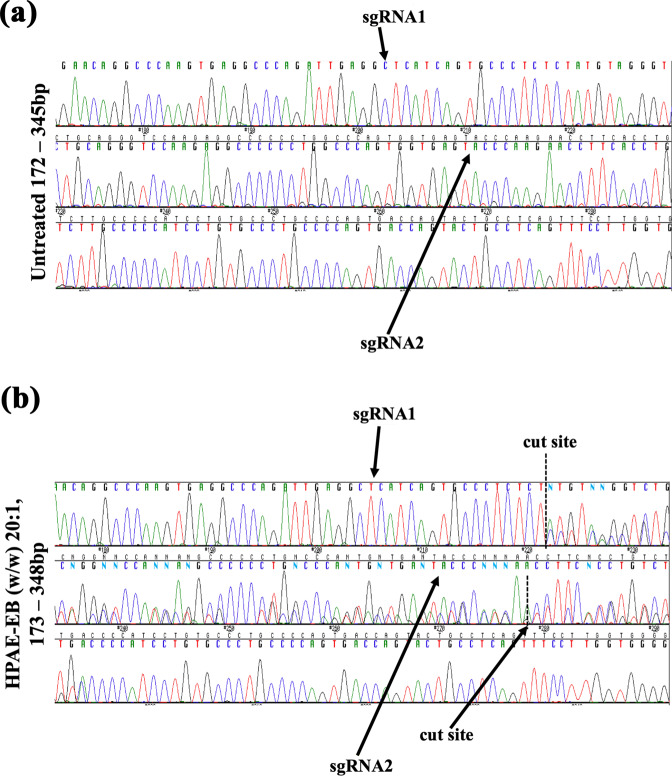
Fig. 9. Chromatograms of Sanger sequenced PCR amplicons of COL7A1 gene.
Guide RNAs denoting cut sites (dashed lines) are indicated highlighting the dual-guide strategy employed. a Sharp single peaks representative of no editing are seen in the control sample. b In contrast, overlapping peaks denoting the mixed pool population of cells are seen directly at cut sites confirming indel generation by HPAE-EB:pDNA (w/w) 20:1 using 0.5 µg DNA treated cells. Data are representative of three replicates from two independent experiments (n = 2).

