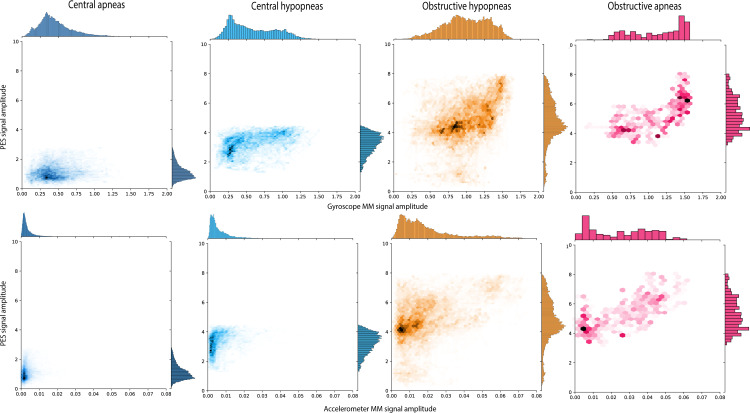
Figure 2.
Joint distribution and relationship between esophageal pressure (PES) and mandibular jaw movement (MM) amplitudes for central and obstructive events. Each of the bidimensional-density plots represents the joint distribution of the amplitudes of PES (y-axis) and MM (x-axis) signals recorded by the gyroscope (Gyr) or accelerometer (Acc) sensor. Due to a large quantity of value points, data were split into several hexagonal units (hexbins).22 The color density of each hexbin is proportional to the number of points in it. A Yeo-Johnson transformation was applied to both PES and MM scale to optimize the normality of the distribution. The same scales were used for PES, MM-Gyr and MM-Acc.

