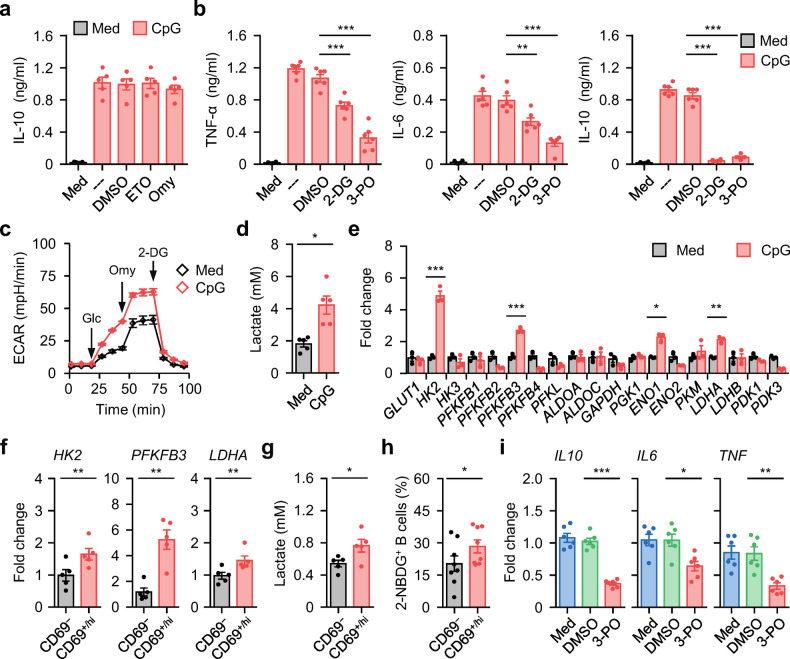
Fig. 4. Metabolic reprogramming involved in inflammatory Breg cell induction.
a, b Total B cells from healthy donors were cultured in medium or pretreated with DMSO, inhibitors against fatty acid oxidation (Etomoxir, ETO) (a), oxidative phosphorylation (Oligomycin, Omy) (a), or glycolysis (2-DG; 3-PO) (b). Thereafter, the cells were incubated in the presence or absence of CPG-DNA. Cytokine production were detected by ELISA (n = 5 for a; n = 6 for b). c–e Total B cells purified from healthy donors were cultured in medium or treated with CPG-DNA for 3 d. Extracellular acidification (ECAR) (c), accumulated lactate production (d), and expression of glycolytic enzymes (e) were measured by seahorse analyzer, lactate assay kit, and real-time PCR, respectively (n = 3 for c and e; n = 5 for d). f–h Expression of key rate-limiting glycolytic enzymes (f), accumulated lactate production (g), and capabilities of glucose incorporation (2-NBDG+) (h) by CD69− and CD69+/hi B cells purified from untreated SLE patients were examined by real-time PCR (f), lactate assay kit (g), and FACS (h), respectively (n = 5 for f and g; n = 8 for h). i Purified CD69+/hi B cells from blood of untreated SLE patients were cultured in medium or in the presence of DMSO, or 3-PO for 12 h. Expression of IL10, IL6, and TNF were examined by real-time PCR. Data were acquired from more than four independent experiments and shown as means ± SEM. Significance was determined with one-way ANOVA test (a, b, i) or Student’s t test (d–h). *p < 0.05, **p < 0.01, ***p < 0.001

