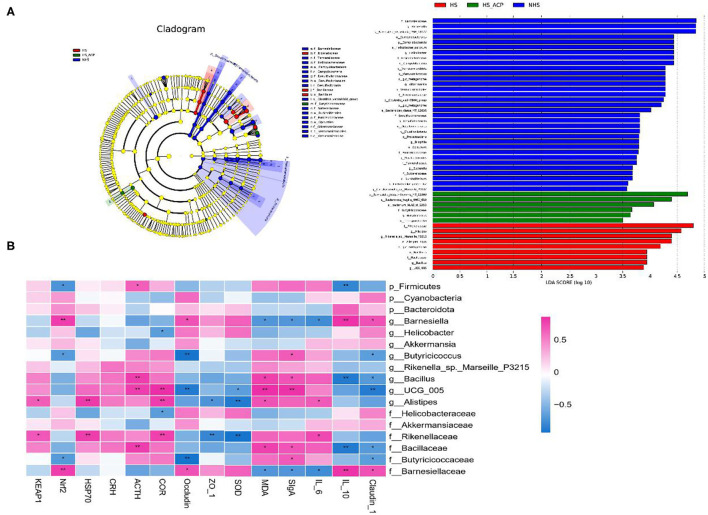
Figure 8.
(A) Difference in dominant microorganisms among each group via cladogram and distribution histogram based on linear discriminant analysis (LDA). Only the results meeting an LDA significant threshold of >3.5 were shown. The greater the LDA score, the more significant the phylotype microbiota was in the comparison, (B) A heatmap showing the Spearman correlation coefficient between several significant enriched intestinal bacteria and measurement parameters. Red cells represent positive correlation and blue cells represent negative correlation. *p < 0.05, **p < 0.01.

