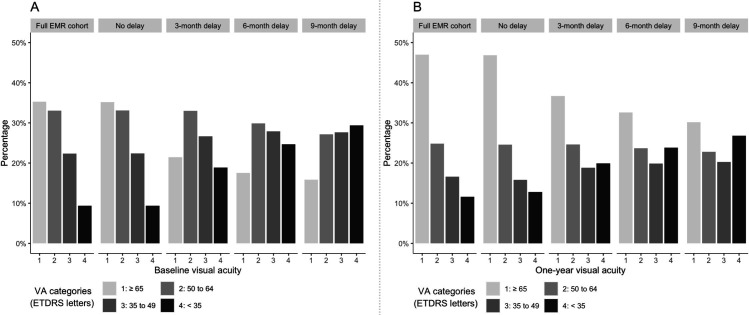
Figure 2.
The average distribution of visual acuities (VAs) across all iterations in the simulation process at baseline (A) and at 1 year (B) for the full EMR nAMD cohort and under four modelled conditions: no, 3-month, 6-month and 9-month treatment delay. EMR, electronic medical records; ETDRS, Early Treatment Diabetic Retinopathy Study.

