Figure 3.

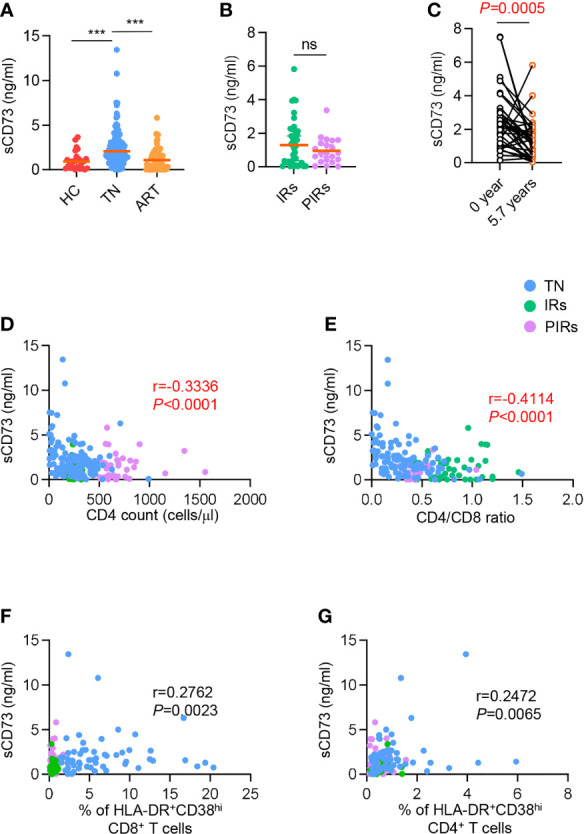
Elevated sCD73 was reversed after ART and associated with clinical outcome. (A) Data were shown as scatter plots comparing the concentration of sCD73 in plasma among HCs, TNs, and ART-experienced PLWH (n=25-110 each group). P values were obtained by Kruskal-Wallis test followed by Dunn’s multiple comparisons test. (B) Scatter plots depicting the concentration of sCD73 among IRs and PIRs with matched baseline CD4 count (n=21-41 each group). P values were obtained by Mann-Whitney test. (C) Longitudinal analysis of sCD73 at baseline and 5.7 years or above following ART (n=38). P values were obtained by Wilcoxon matched-pairs signed-rank test. (D-G) Correlation analysis of sCD73 level with CD4 count (D), CD4/CD8 ratio (E), HLA-DR+CD38hi CD8+ T cells (F), and HLA-DR+CD38hi CD4+ T cells (G). Spearman’s non-parametric test was used to test for correlations. ***P<0.001. ns, not significant.
