
Figure 10.
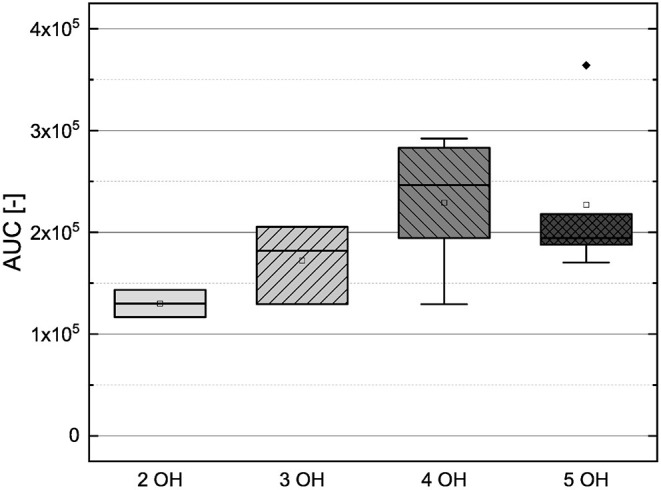
Boxplot of the mean values of results according to their number of hydroxyl groups in the ORAC assay. The range within standard errors (1.5 interquartile range) is represented by error bars.
Official websites use .gov
A
.gov website belongs to an official
government organization in the United States.
Secure .gov websites use HTTPS
A lock (
) or https:// means you've safely
connected to the .gov website. Share sensitive
information only on official, secure websites.
Boxplot of the mean values of results according to their number of hydroxyl groups in the ORAC assay. The range within standard errors (1.5 interquartile range) is represented by error bars.