Figure 11.

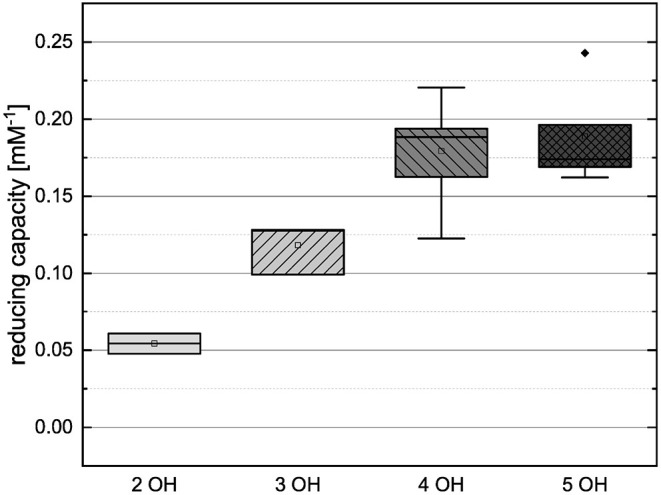
Boxplot of the mean values of results according to their number of hydroxyl groups in the FC assay. The range within standard errors (1.5 interquartile range) is represented by error bars.

Boxplot of the mean values of results according to their number of hydroxyl groups in the FC assay. The range within standard errors (1.5 interquartile range) is represented by error bars.