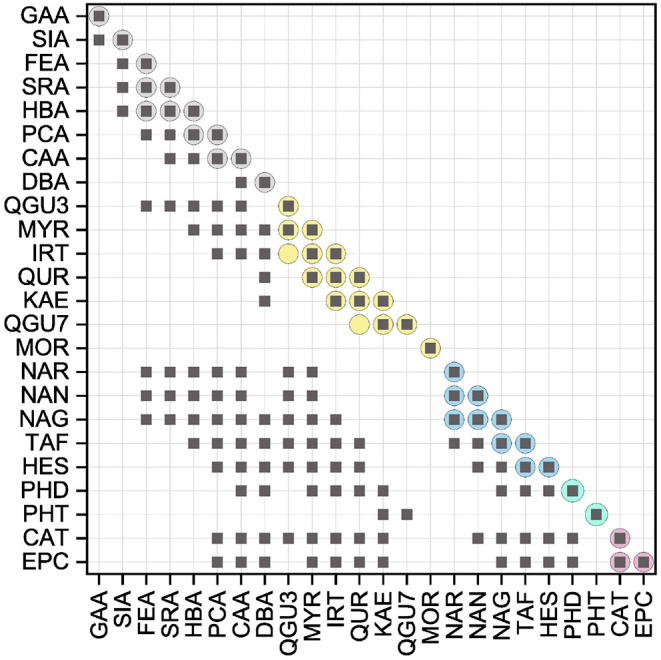
Figure 4.

Results of the statistical analysis of the ORAC results with a significance level at P < 0.05. Squares indicate the results, which were not significantly different (P > 0.05) using all standard references. Circles indicate the results of the statistical analysis within the subgroups, which were not significantly different (P > 0.05).
