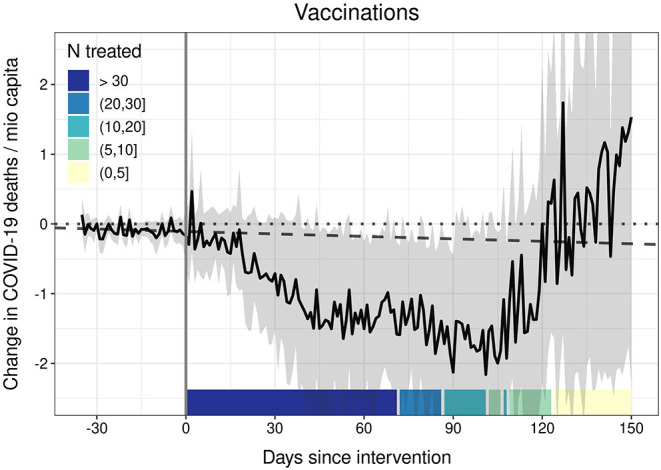
Figure 2.

The effect of vaccinations (vaccine doses per inhabitant ≥80 %) on COVID-19 deaths. Generalized synthetic control estimator based on daily data. The black solid line represents the average treatment effect on the treated (ATT). Ribbons represent 95% non-parametric confidence intervals based on 1,000 bootstrap runs. The dotted line is the null line. The dashed line represents the linear prediction based on the 35 days before the intervention. Controls: 10 NPIs as stringency index, temperature, temperature2, cloud cover, precipitation, humidity, 7-day backwards rolling average of NPI-residualized COVID-19 cases at t – 7, t – 14, t – 21, t – 28, and t – 35.
