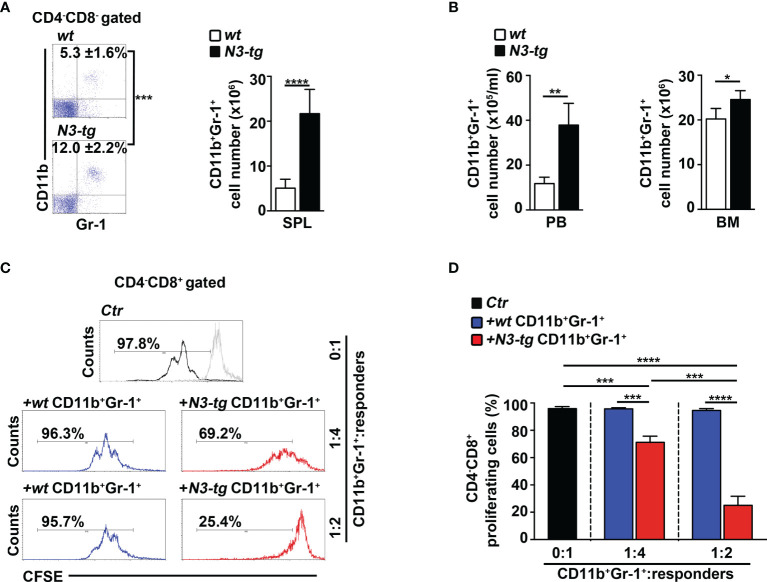
Figure 1.
CD11b+Gr-1+ MDSCs expand in N3-tg mice. (A) Percentages and absolute numbers of CD11b+Gr-1+ cells, as assessed by FACS analysis distribution of CD4 vs. CD8 vs. CD11b vs Gr-1 markers in spleen (SPL) of N3-tg and wt mice. Numbers inside cytograms indicate mean percentages ± SD of CD11b+Gr-1+ cells. The cytograms in this panel illustrate the percentages of CD11b+Gr-1+ splenocytes inside the CD4−CD8− subset, to avoid any possible dilution effect due to the presence of DP T cells in transgenic mice. (B) CD11b+Gr-1+ numbers in peripheral blood (PB) and BM from N3-tg vs. wt mice, assessed by FACS analysis, as in (A). In (A, B), the values are presented as mean ± SD of four independent experiments (n = 6 mice per group). (C) Representative FACS analysis of suppression assay with CFSE-labeled/activated wt T splenocytes (“responders”), cultured either alone (Ctr), as a control, or in combination with CD11b+Gr-1+ “putative” MDSCs (“suppressors”). Numbers inside cytograms represent percentages of proliferating CD4−CD8+ responder cells. Similar results were obtained by analyzing the proliferation rate of gated wt CD4+CD8− T responder cells (not shown). CD11b+Gr-1+ cells were sorted from spleen of N3-tg or wt mice and used at the indicated CD11b+Gr-1+:responders ratio. The gray line represents nonactivated negative controls. In (D), results of suppression test, as in (C), are illustrated as mean values ± SD from three independent experiments (n = 3 mice per group), with two technical replicates per experiment. All the mice were analyzed at 12 weeks of age. * p ≤ 0.05, ** p ≤ 0.01, *** p ≤ 0.001, and **** p ≤ 0.0001 represent significant differences between the indicated groups.

