Figure 2.
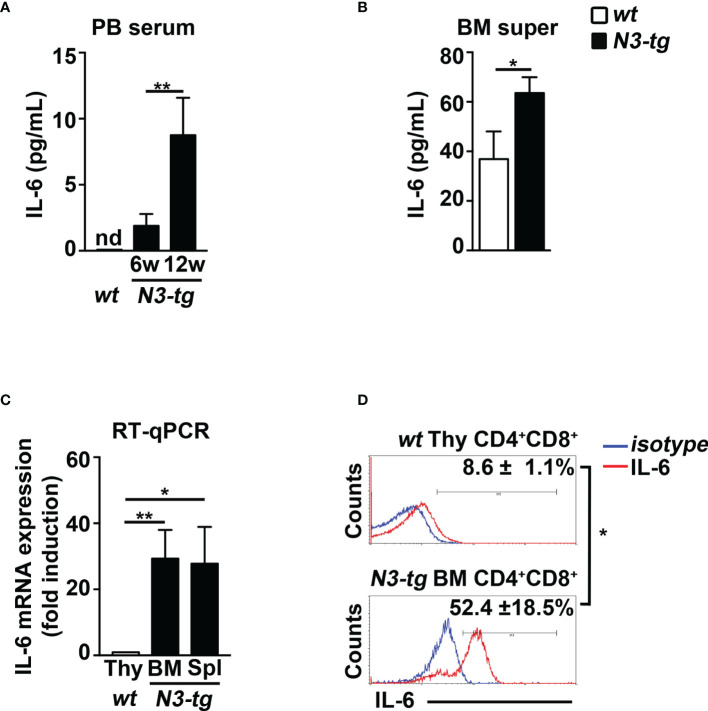
N3-tg mice display high levels of IL-6. IL-6 protein concentration assessed by ELISA (A) in blood serum (PB serum), from N3-tg vs. wt mice at 6 and 12 weeks of age, and (B) in BM supernatant (BM super), from N3-tg vs. wt mice at 12 weeks of age. (C) RT-qPCR of relative IL-6 mRNA expression in DP T cells sorted from BM or spleen (Spl) of N3-tg mice or from wt thymus (Thy), as a control, at 12 weeks of age. IL-6 mRNA expression levels in wt DP thymocytes are set as 1. (D) Representative FACS analysis of intracellular IL-6 staining in DP T cells from N3-tg BM or from wt thymus (Thy), at 12 weeks of age, upon 4 h of PMA/ionomycin stimulation (red lines). Blue lines, isotype controls. Numbers inside cytograms represent mean percentages ± SD of IL-6+ cells inside CD4+CD8+ subset. The values are presented as mean ± SD from three independent experiments (n = 4 mice per group), and in (A–C) with three technical replicates per experiment. nd, not detectable; * p ≤ 0.05 and **p ≤ 0.01 represent significant differences between the indicated groups.

