Figure 3.

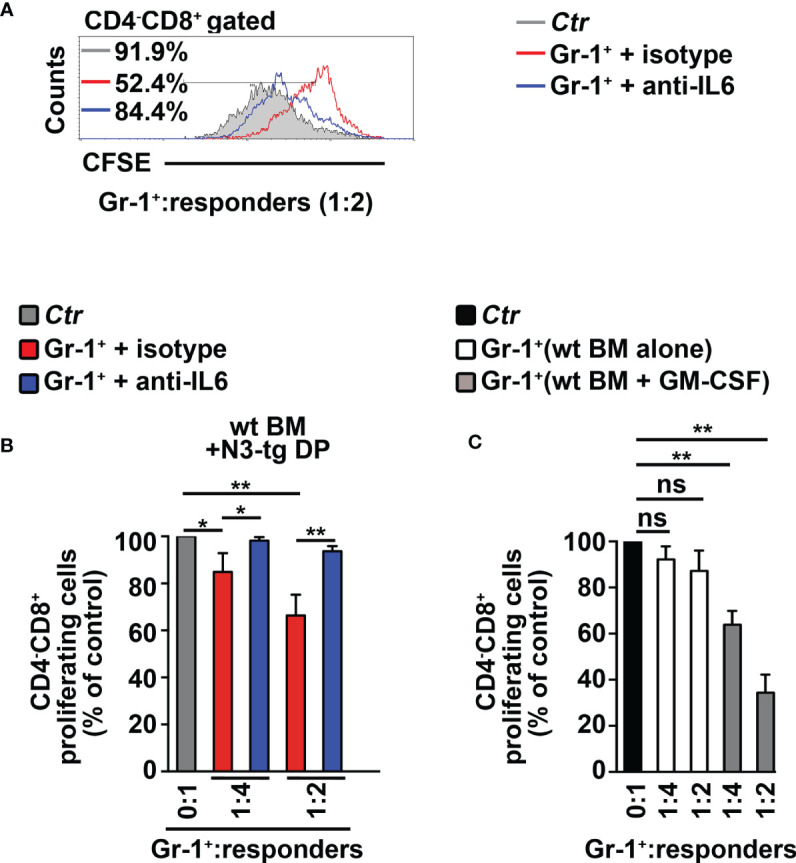
CD4+CD8+ (DP) T cells from N3-tg mice drive in vitro differentiation of MDSCs through IL-6. (A) Representative FACS analysis of suppression assay with CFSE/activated wt T splenocytes (“responders”), cultured either alone (Ctr), as a control, or in combination with Gr-1+ cells (Gr-1+), at the indicated Gr-1+/responders ratio. Numbers inside cytograms indicate the percentages of proliferating wt CD4−CD8+ T responder cells. Gr-1+ cells were magnetically selected from 5-day cocultures of total wt BM cells with DP T cells from BM of N3-tg, in the presence of anti-IL-6-neutralizing antibodies (blue line) or isotype controls (red line), and by using transwell inserts. In (B), the results of the same suppression test, as in (A), are illustrated as mean values ± SD from multiple experiments, see below. (C) The suppression test was performed by using wt T responder cells cultured either alone (black bar), as a control, or in combination with Gr-1+ cells (Gr-1+), selected, as above, from total wt BM cells cultured in medium alone or supplemented with GM-CSF (white bars and gray bars, respectively), for 5 days, and used at the indicated Gr-1+:responders ratios. In (B, C), the results are calculated as the ratio between percentages of proliferating CD4−CD8+ T responder cells in Gr-1+-containing cultures and in controls, set up in the absence of Gr-1+ cells, and are expressed as % of control. The results represent the mean values ± SD from three independent experiments (n = 3 mice per group), with two technical replicates per experiment. ns, not significant, p > 0.05; * p ≤ 0.05, and ** p ≤ 0.01 represent significant differences between the indicated groups.
