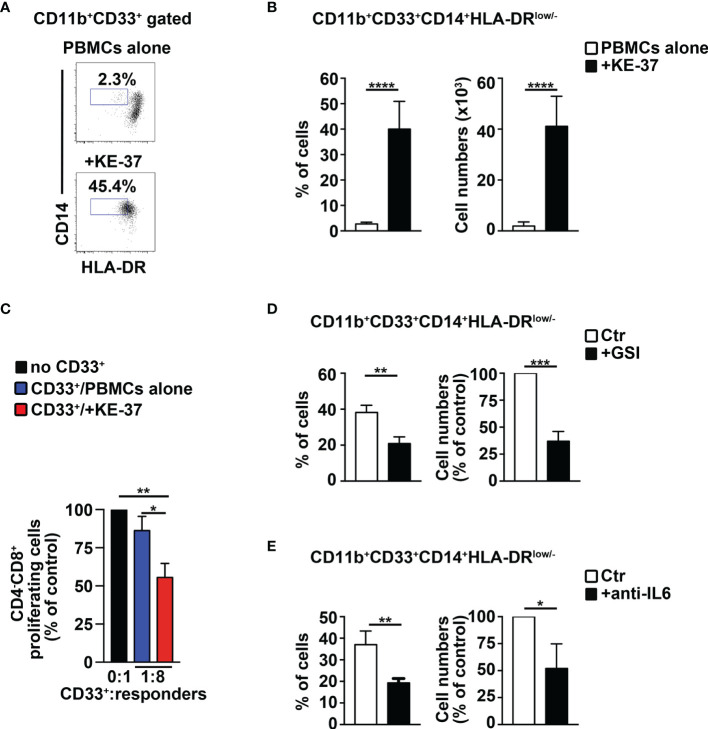
Figure 7.
The Notch1-active T-ALL cell line, KE-37 induces MDSCs from healthy PBMCs. PBMCs from healthy donors were cocultured with the human Notch1-dependent T-ALL cell line, KE-37, or were cultured in medium alone, as a control, for 6 days, by using transwell inserts. The data shown are relative to the end of the culture. (A) Representative dot plot of CD14+HLA-DRlow/neg cells inside CD11b+CD33+ subset, as measured by FACS analysis in harvested PBMCs/KE-37 coculture samples (+KE-37), versus samples of autologous PBMCs cultured alone (PBMCs alone). Numbers inside cytograms indicate the percentages of CD11b+CD33+CD14+HLA-DRlow/neg cells. (B) Percentages and absolute numbers of CD11b+CD33+CD14+HLA-DRlow/neg cells, measured by the same FACS analysis, as in (A). The values are presented as mean ± SD from four independent experiments (n = 6 samples per group, donors n = 6), each in triplicates. (C) At the end of the coculture assay above, CD33+ fractions were magnetically selected from harvested samples and used as “putative” suppressors (CD33+) in a suppression test on proliferating CD4−CD8+-gated cells (“responders”), from CFSE-labeled/activated autologous PBMCs, at the indicated CD33+:responder ratios. CD33+ cells were selected from PBMCs cultured either in medium alone (CD33+/PBMCs alone) or with KE-37 cells (CD33+/+KE-37). The results are illustrated as the ratio between the percentages of proliferating CD4−CD8+-gated cells in cultures containing CD33+ and in control cultures set up in the absence of CD33+ (no CD33+) and expressed as % of control. In (D, E), the graphs report percentages and cell count proportions of CD11b+CD33+CD14+HLA-DRlow/neg cells in harvested PBMCs/KE-37 cocultures, assessed by the same FACS analysis, as in (A). The samples in (D) were cultured in the absence (CTR) or presence of GSI (+GSI), and the samples in (E) were cultured in the absence (CTR) or presence of anti-IL-6-neutralizing antibodies (+anti-IL-6). The cell count proportions were calculated as the ratio between the CD11b+CD33+CD14+HLA-DRlow/neg absolute numbers in PBMCs/KE-37 treated cocultures and in relative untreated controls and expressed as % of control. In (C–E), the values represent the mean ± SD from three independent experiments (n = 3 samples per group, donors n = 3), each in triplicates. * p ≤ 0.05, ** p ≤ 0.01, *** p ≤ 0.001, and **** p ≤ 0.0001 represent significant differences between the indicated groups.

