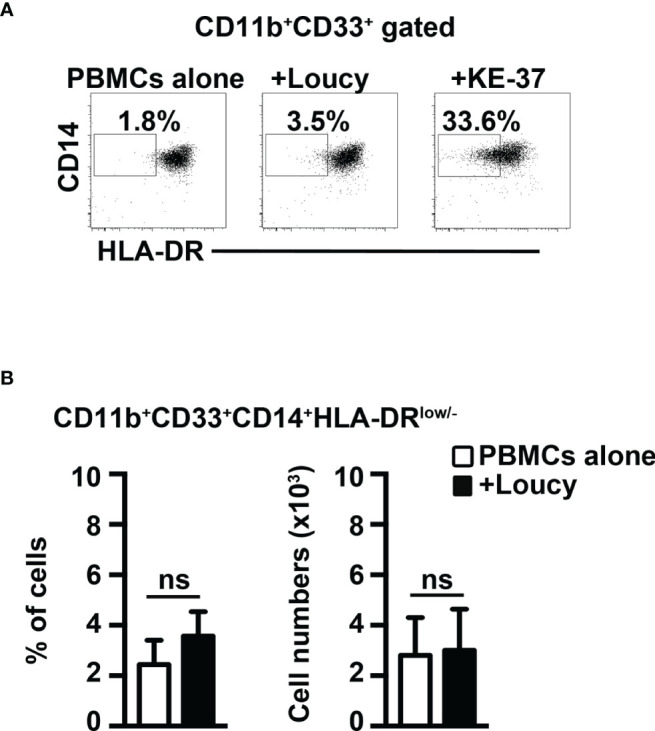
Figure 8.

The Notch-inactive T-ALL cell line, Loucy, does not induce MDSCs from healthy PBMCs. (A) Representative dot plot of CD14+HLA-DRlow/neg cells inside CD11b+CD33+ subset, as measured by FACS analysis in harvested PBMCs/Loucy coculture samples (+Loucy), vs. samples of autologous PBMCs cultured alone (PBMCs alone). PBMCs/KE-37 coculture samples (+KE-37) were also included as positive controls of MDSC induction. Numbers inside cytograms indicate the percentages of CD11b+CD33+CD14+HLA-DRlow/neg cells. (B) Percentages (left panel) and absolute numbers (right panel) of CD11b+CD33+CD14+HLA-DRlow/neg cells, as measured by the same FACS analysis, as in (A). In (B), the values represent the mean ± SD from three independent experiments (n = 4 samples per group, donors n = 4), each in duplicates. ns, not significant.
