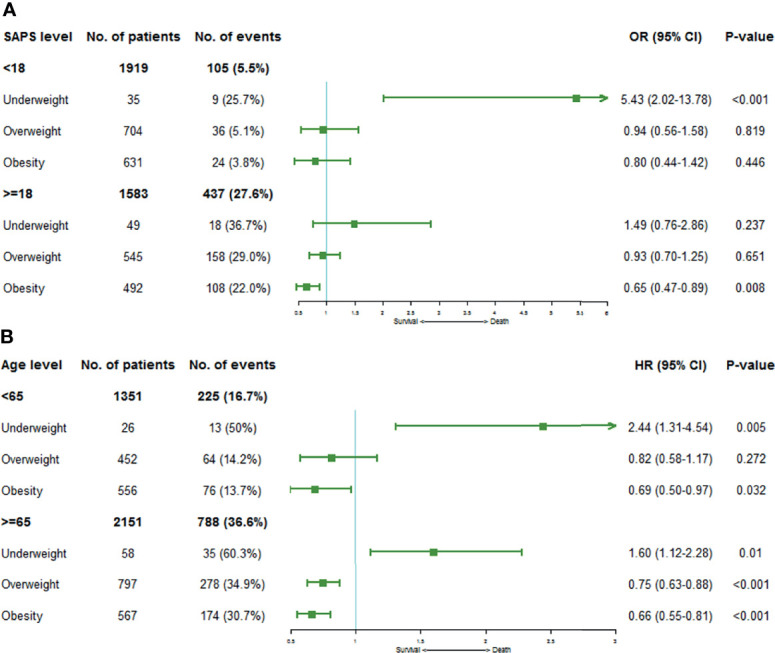
Figure 4.

Forest plots depicting the ORs or HRs of mortality risks on the stratification of SAPS and age levels by BMI category. (A) shows ORs of 30-day mortality stratified by SAPS levels, and (B) demonstrates HRs of 1-year mortality on the stratification of age levels. Squares represent ORs or HRs with 95% CIs demonstrated as horizontal bars. Normal weight category acts as the reference group.
