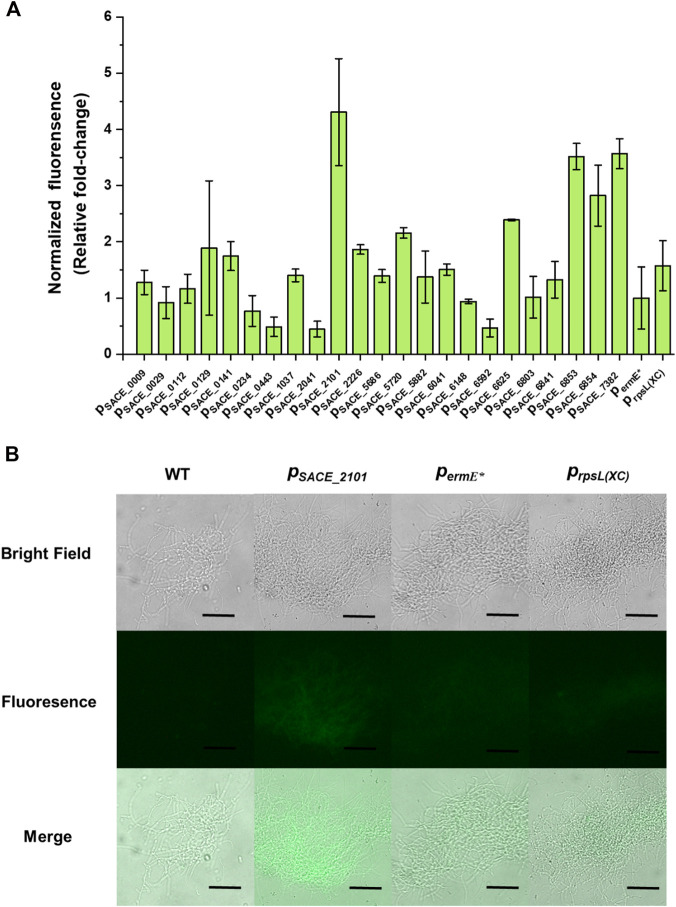
FIGURE 1.
Native promoters characterization in S. erythraea NRRL 23338. (A) Relative normalized green fluorescence of different eGFP-expressing strains compared to the p ermE* -harboring strain (fold-change). Error bars represented the standard deviation of three parallel samples. (B) Fluorescence microscope observation of wild-type strain S. erythraea NRRL 23338 and eGFP-expressing strains harboring promoters p SACE_2101 , p ermE* , and p rpsL(XC) . Scale bar: 50 μm.

