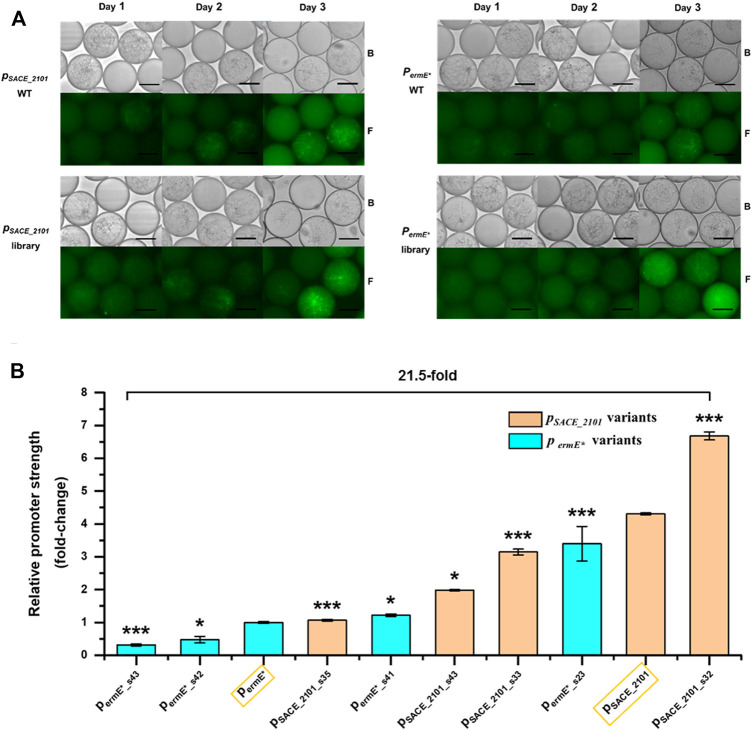
FIGURE 3.
Promoter screening by FADS. (A) Fluorescence microscopy of droplets containing wild-type stains (p SACE_2101 WT, p ermE* WT) and variants (p SACE_2101 library, p ermE* library) at different time intervals. B: Bright field. F: Fluorescence. Scale bar: 50 μm. (B) Relative strengths of the screened promoter variants in libraries SACE_2101 (lib) (p SACE_2101 library) and ermE*(lib) (p ermE* library) compared to their corresponding WTs (Surrounded by yellow frames). Error bars represented the standard deviation of three biological samples. *p ≤ 0.05 and ***p ≤ 0.001 (Student’s two-tailed t-test).

