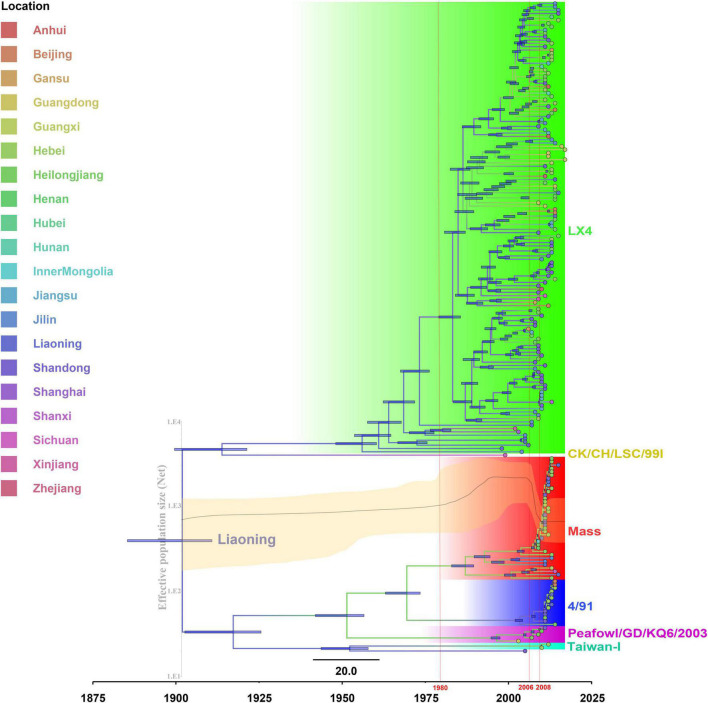
FIGURE 3.
The maximum clade credibility tree and Bayesian skyline plot (BSP) of full-length genome sequences of infectious bronchitis viruses (IBVs) (see section “Materials and Methods” for further details). The maximum clade credibility (MCC) tree was constructed with 10% burn-in by Tree Annotator version 1.10.4 implemented in the BEAST software package. The color of the branches corresponds to geographical areas. A change in branch color indicates a time and geographical area change during the genotype’s evolutionary history. The scale bar represents the unit of time (year). Bayesian skyline plot (BSP) is superimposed to the tree in the same time-scale (x-axis). The y-axis represents the effective population size (log10 scale). The black line represents the effective population size through time, and the orange area around the line represents the 95% highest posterior density (HPD) of the estimates.

