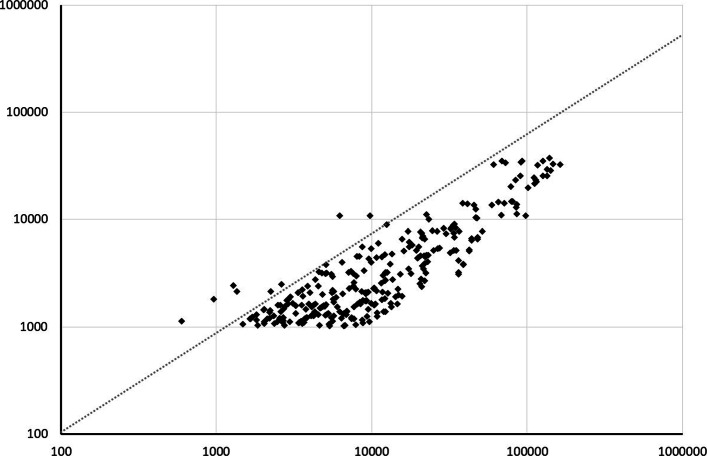
Fig. 5.
Daily traffic estimates (X-axis) and FB data (Y-axis) by corridor (1 March 2020). Sources: Numbers of daily commuters are extracted from Eurostat data by Nuts2 region in 2019; Numbers of air passengers are extracted from Eurostat monthly statistics on air passenger transport on March 1, 2020; Data on international migrants are extrapolated from [34] for the year 2015, assuming a conservative 50% growth in the flows between 2015 and 2020. FB data are the Facebook data on daily border crossings on March 1, 2020. Note: All variables are expressed in logs

