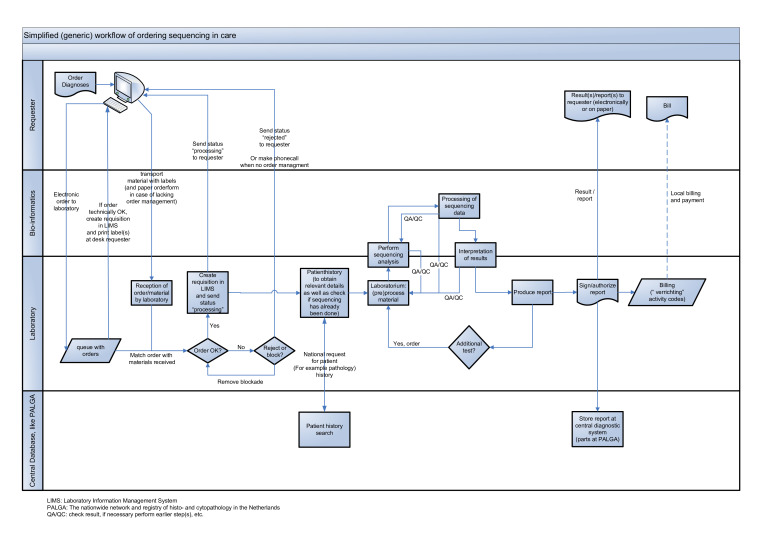
Figure 1.
High-level, simplified generic data and workflow flow chart showing the natural order of sequential subprocesses, starting with the ordering of a next generation sequencing (NGS) test (left side of the diagram) and following through to the reporting of the test results (right side of the diagram). The diagram is divided into four lanes to indicate which participants handle which subprocesses (the blue items/forms) and shows handover moments for either materials and/or data (the connecting arrows). The participants in this process include the individual requester of the NGS analysis, the bioinformatician, the laboratory and the workflow-relevant (national) databases. LIMS, laboratory information management system; PALGA, the nationwide network and registry of histopathology and cytopathology in the Netherlands; QA/QC, check result, if necessary perform earlier step(s), etc.

