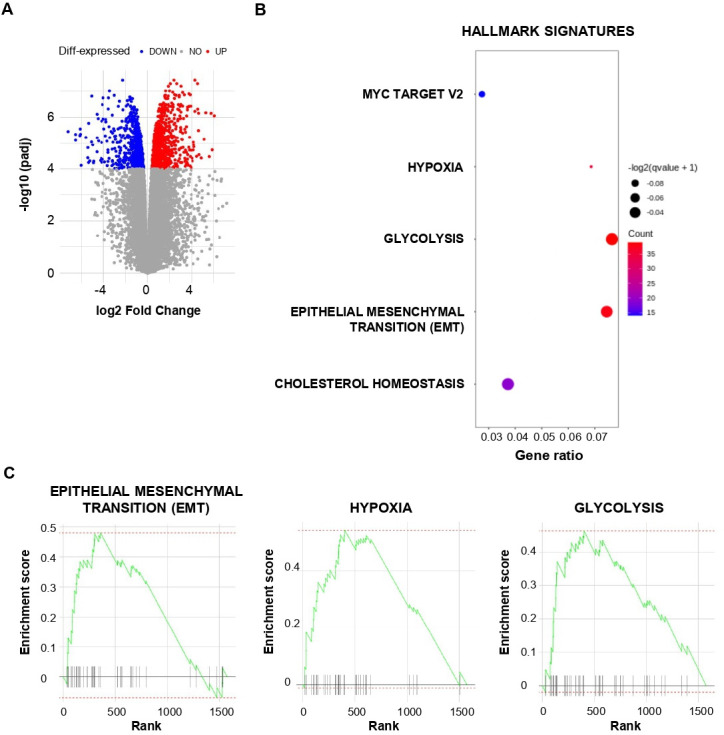
Figure 3.

Transcriptional analysis of lung cancer stem cell (CSC). (A) Volcano plot of differential gene expression in CSC versus IGR-Heu analyzed by RNA-based next-generation sequencing (RNA-seq). Points are colored according to their average expression in all data sets. Red points are for genes upregulated in CSC, and blue points for downregulated genes. The expression difference is considered significant for an adjusted p value <10−4. (B) Dot plot showing the results of gene set enrichment analysis (GSEA) with a false discovery rate q value <0.1 using HALLMARK terms (MSigDB, HALLMARK, V.7.4). Each dot plot demonstrates enriched terms in transcriptome of CSC. The size of the dot represents the adjusted p value, and color represents the count of enriched genes. (C) GSEA of the gene set from Hallmark signatures (MSigDB, HALLMARK, V.7.4) in the transcriptome of CSC relative to IGR-Heu (n=3). Enrichment score for the gene set as the analysis ‘walks down’ the ranked list of genes; the position of gene set members (black vertical lines) in the ranked list of genes and the value of ranking metric are shown. A set of EMT genes enriched in the top-ranking genes is shown by a green line.
