Figure 4.

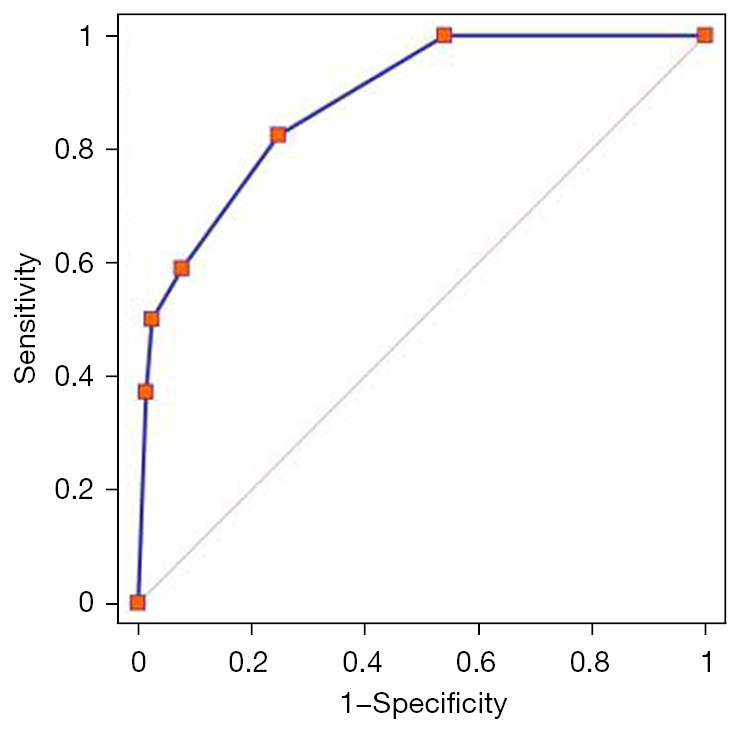
ROC curves of the PCP scheme. The area under the ROC of the PCP scheme (the blue line) to identify unstable lesions was 0.883 (95% CI: 0.845–0.914, P<0.0001). ROC, receiver-operating characteristic; PCP, plaque-calcification-pattern.

ROC curves of the PCP scheme. The area under the ROC of the PCP scheme (the blue line) to identify unstable lesions was 0.883 (95% CI: 0.845–0.914, P<0.0001). ROC, receiver-operating characteristic; PCP, plaque-calcification-pattern.