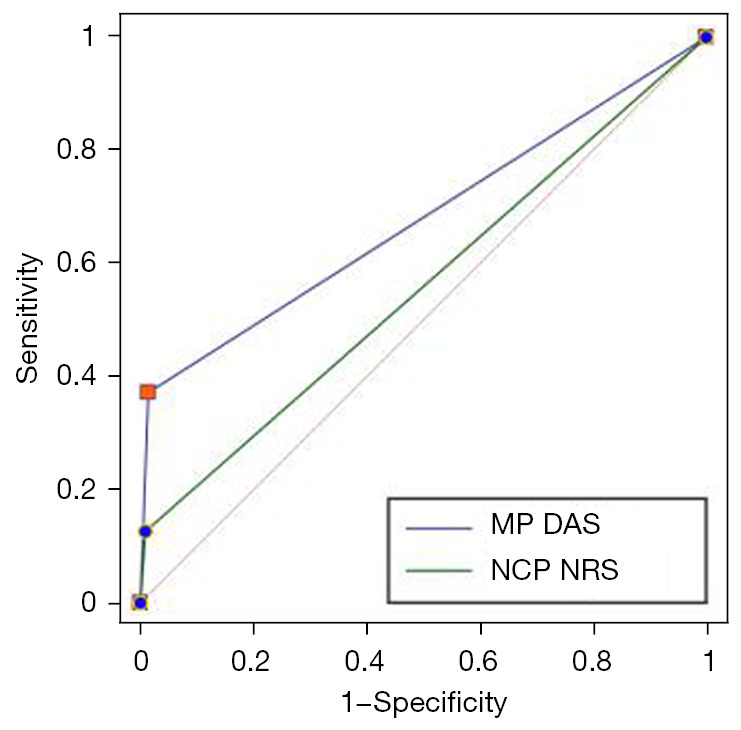
Figure 5.

ROC curves to compare DAS versus NRS in our PCP scheme. The area under the ROC curve was 0.756 for DAS (the blue line) and 0.558 for NRS (green line), P<0.001. MP, mixed plaque; DAS, diamond-attenuation sign; NCP, non-calcified plaque; NRS, napkin-ring-sign; ROC, receiver-operating characteristic (95% CI: 0.717–0.791 vs. 0.514–0.600); PCP, plaque-calcification-pattern.
