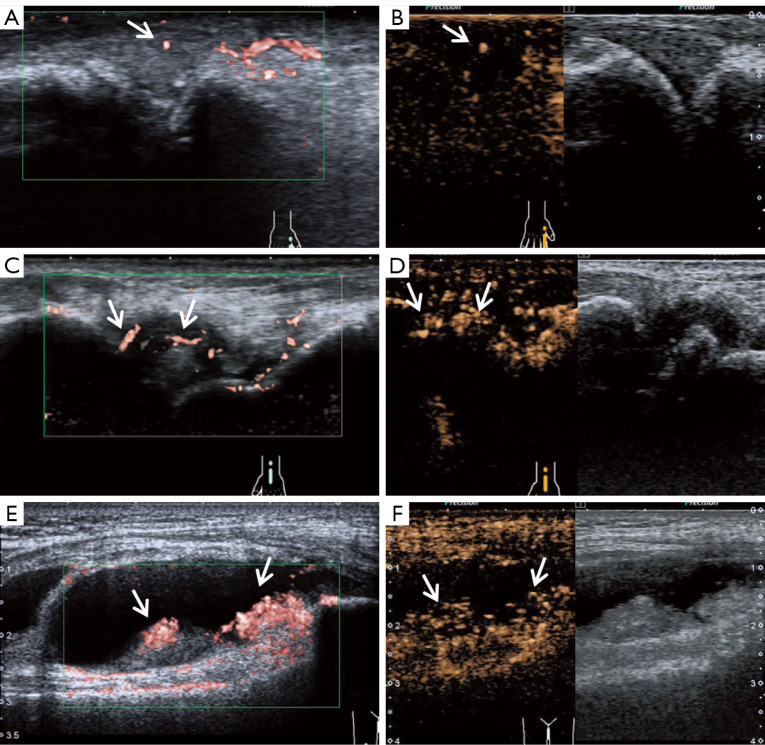
Figure 2.
Representative superb microvascular imaging (SMI) and contrast-enhanced ultrasound (CEUS) images of synovium vascularity (SV). (A,B) Wrist: a single SMI signal in the synovium, and CEUS showing tiny echogenic spots (Grade 1). (C,D) Wrist: confluent SMI signals in less than half the area of the synovium (Grade 2), and slow-flow vessel enhancement (arrows) detected on CEUS (Grade 2). (E,F) Knee: SMI signals and CEUS enhancement in more than half the area of the synovium (Grade 3). Arrow point to the vessels.

